Prometheus for TDengine Cloud
Prometheus is a widespread open-source monitoring and alerting system. Prometheus joined the Cloud Native Computing Foundation (CNCF) in 2016 as the second incubated project after Kubernetes, which has a very active developer and user community.
Prometheus provides remote_write interface to leverage other database products as its storage engine. To enable users of the Prometheus ecosystem to take advantage of TDengine's efficient writing, TDengine also provides support for this interface so that Prometheus data can be stored in TDengine via the remote_write interface with proper configuration to take full advantage of TDengine's efficient storage performance and clustering capabilities for time-series data.
Prerequisites
In your TDengine cloud instance, click "Explorer" on the left panel, then click "+" besides Databases, to create a new database named as "prometheus_data". Then execute show databases to confirm the database has been created successfully.
Install Prometheus
Supposed that you use Linux system with architecture amd64:
-
Download
wget https://github.com/prometheus/prometheus/releases/download/v2.37.0/prometheus-2.37.0.linux-amd64.tar.gz -
Decompress and rename
tar xvfz prometheus-*.tar.gz && mv prometheus-2.37.0.linux-amd64 prometheus -
Change to directory prometheus
cd prometheus
Then Prometheus is installed in current directory. For more installation options, please refer to the official documentation.
Configure Prometheus
Configuring Prometheus is done by editing the Prometheus configuration file prometheus.yml (If you followed previous steps, you can find prometheus.xml in current directory).
remote_write:
  - url: "<cloud_url>/prometheus/v1/remote_write/prometheus_data?token=<cloud_token>"

remote_read:
  - url: "<cloud_url>/prometheus/v1/remote_read/prometheus_data?token=<cloud_token>"
    remote_timeout: 10s
    read_recent: true
You are expected to replace <cloud_url> and <cloud_token> with real TDengine cloud URL and token. To obtain the real values, please log in TDengine Cloud.
The resulting configuration will collect data about prometheus itself from its own HTTP metrics endpoint, and store data to TDengine Cloud.
Start Prometheus
./prometheus --config.file prometheus.yml
Prometheus should start up. It also started a web server at http://localhost:9090. If you want to access the web server from a browser which is not running on the same host as Prometheus, please change localhost to correct hostname, FQDN or IP address, depending on your network environment.
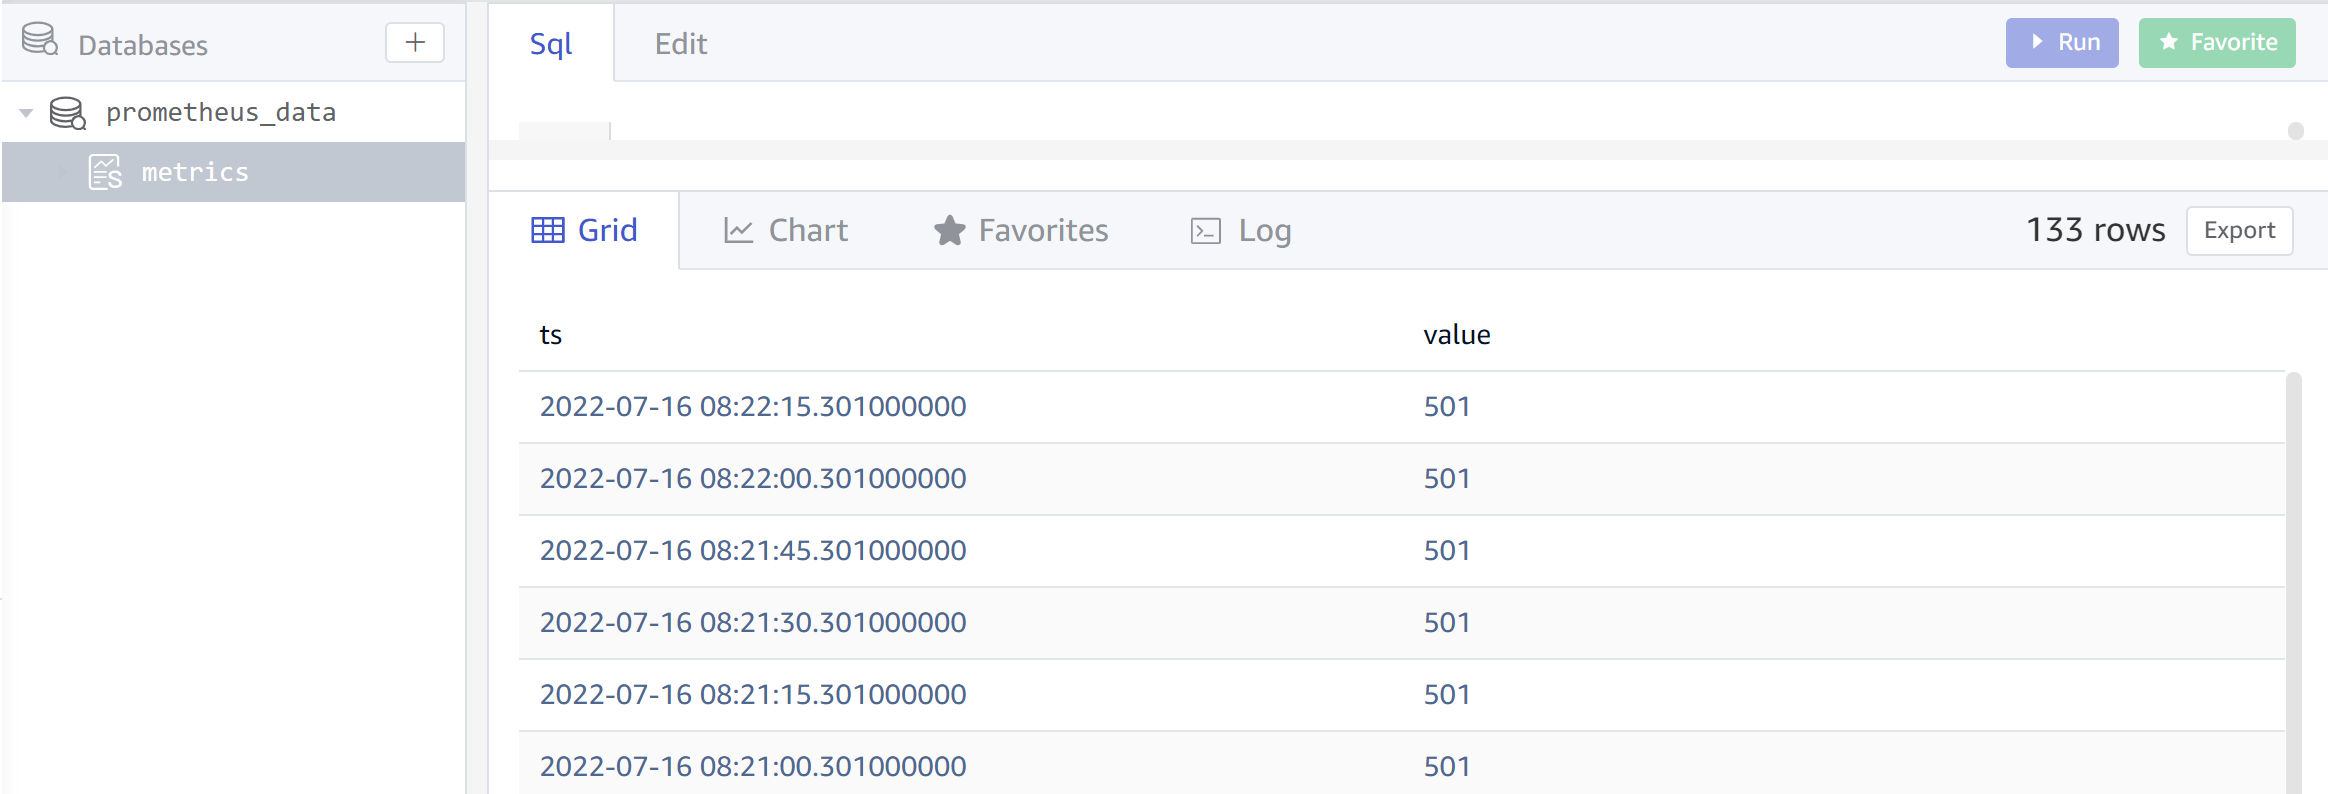
Verify Remote Write
Log in TDengine Cloud, click "Explorer" on the left navigation bar. You will see metrics collected by prometheus.
- TDengine will automatically create unique IDs for sub-table names by the rule.