Tools - Yonghong BI
Yonghong one-stop big data BI platformto provide enterprises of all sizes with flexible and easy-to-use whole-business chain big data analysis solutions, so that every user can use this platform to easily discover the value of big data and obtain deep insight. TDengine can be added to Yonghong BI as a data source via a JDBC connector. Once the data source is configured, Yonghong BI can read data from TDengine and provide functions such as data presentation, analysis and prediction.
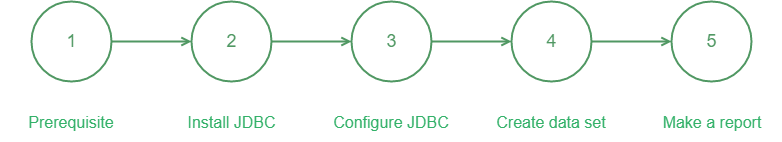
Prerequisite
- Yonghong Desktop Basic is installed and running (if not,please go to official download page of Yonghong Technology download).
- The TDengine is installed and running, and ensure that the taosadapter service is started on the TDengine server side.
Install JDBC Connector
Go to maven.org download the latest TDengine JDBC connector (current version 3.2.7) and install it on the machine where the BI tool is running.
Configure JDBC DataSource
- In the Yonghong Desktop BI tool, click "Add data source" and select the "GENERIC" type in the SQL data source.
- Click "Select Custom Driver", in the "Driver Management" dialog box, click "+" next to "Driver List", enter the name "MyTDengine". Then click the "upload file" button to upload just download TDengine JDBC connector file "taos-jdbcdriver-3.2.7-dist.jar", and select "com.taosdata.jdbc.rs.RestfulDriver" drive, Finally, click the "OK" button to complete the driver addition.
- Then copy the following into the "URL" field:
jdbc:TAOS-RS://localhost:6041?user=root&password=taosdata
- Then select "No identity Authentication" under "Authentication Mode".
- In the advanced Settings of the data source, change the value of the Quote symbol to the backquote "`".
- Click "Test connection" and the dialog box "Test success" will pop up. Click the "Save" button and enter "tdengine" to save the TDengine data source.
Create TDengine datasets
- Click "Add Data Set" in the BI tool, expand the data source you just created, and browse the super table in TDengine.
- You can load all the data of the super table into the BI tool, or you can import some data through custom SQL statements.
- When "Computation in Database" is selected, the BI tool will no longer cache TDengine timing data and will send SQL requests to TDengine for direct processing when processing queries.
When data is imported, the BI tool automatically sets the numeric type to the "metric" column and the text type to the "dimension" column. In TDengine super tables, ordinary columns are used as data metrics and label columns are used as data dimensions, so you may need to change the properties of some columns when you create a dataset. On the basis of supporting standard SQL, TDengine also provides a series of special query syntax to meet the requirements of time series business scenarios, such as data segmentation query, window segmentation query, etc., for TDengine Specialized Queries .By using these featured queries, BI tools can greatly improve data access speed and reduce network transmission bandwidth when they send SQL queries to TDengine databases.
In BI tools, you can create "parameters" and use them in SQL statements, which can be dynamically executed manually and periodically to achieve a visual report refresh effect.The following SQL statement:
select _wstart ws, count(*) cnt from supertable where tbname=?{metric} and ts >= ?{from} and ts < ?{to} interval(?{interval})
Data can be read in real time from TDengine, where:
_wstart: Indicates the start time of the time window.count(*): Indicates the aggregate value in the time window.?{interval}: Indicates that the parameter interval is introduced into the SQL statement. When the BI tool queries data, it assigns a value to the parameter interval. If the value is 1m, the sampling data is reduced based on a 1-minute time window.?{metric}: This parameter is used to specify the name of the data table to be queried. When the ID of a drop-down parameter component is set as metric in the BI tool, the selected items of the drop-down parameter component are bound to this parameter to achieve dynamic selection.?{from}?{to}:These two parameters are used to represent the time range of the query data set and can be bound with the Text Parameter Component.
You can modify the data type, data range, and default values of parameters in the "Edit Parameters" dialog box of the BI tool, and dynamically set the values of these parameters in the "Visual Report".
Create a visual report
- Click "Make Report" in Yonghong BI tool to create a canvas.
- Drag visual components, such as Table Components, onto the canvas.
- Select the data set to be bound in the Data Set sidebar, and bind Dimensions and Measures in the data column to Table Components as needed.
- Click "Save" to view the report.
- For more information about Yonghong BI tools, please consult them Help document.