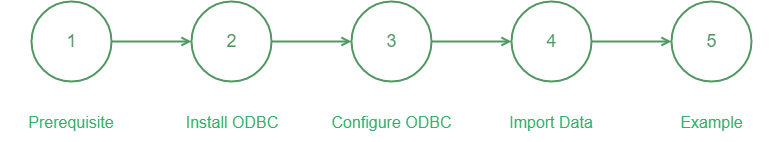
Tools - Power BI
Power BI is a business analytics tool provided by Microsoft. With TDengine ODBC driver, PowerBI can access time series data stored in the TDengine. You can import tag data, original time series data, or aggregated data into Power BI from a TDengine, to create reports or dashboard without any coding effort.
Prerequisite
- TDengine server software is installed and running.
- Power BI Desktop has been installed and running (If not, please download and install the latest Windows X64 version from PowerBI ).
Install ODBC connector
- Only support Windows operation system. And you need to install VC Runtime Library first. If already installed, please ignore this step.
- Install TDengine Windows client installation package.
Configure ODBC DataSource
- Click the "Start" Menu, and Search for "ODBC", and choose "ODBC Data Source (64-bit)" (Note: Don't choose 32-bit).
- Select the "User DSN" tab, and click "Add" button to enter the page for "Create Data Source".
- Choose the data source to be added, here we choose "TDengine" and click "Finish", and enter the configuration page for "TDengine ODBC Data Source", fill in required fields as the following:
[DSN]: Data Source Name, required field, such as "MyTDengine"
Depending on your TDengine server version, download appropriate version of TDengine client package from TDengine website Download Link, or TDengine explorer if you are using a local TDengine cluster. Install the TDengine client package on same Windows machine where PowerBI is running.
[URL]: taos://localhost:6041
[Database]: optional field, the default database to access, such as "test"
[UserID]: Enter the user name. If this parameter is not specified, the user name is root by default
[Password]: Enter the user password. If not, the default is taosdata
- Click "Test Connection" to test whether the data source can be connectted; if successful, it will prompt "Successfully connected to taos://root:taosdata@localhost:6041".
Import Data from TDengine to Power BI
- Open Power BI and logon, add data source following steps "Home" -> "Get data" -> "Other" -> "ODBC" -> "Connect".
- Choose the created data source name, such as "MyTDengine", then click "OK" button to open the "ODBC Driver" dialog. In the dialog, select "Default or Custom" left menu and then click "Connect" button to connect to the configured data source. After go to the "Nativator", browse tables of the selected database and load data.
- If you want to input some specific SQL, click "Advanced Options", and input your SQL in the open dialogue box and load the data.
To better use Power BI to analyze the data stored in TDengine, you need to understand the concepts of dimention, metric, time serie, correlation, and use your own SQL to import data.
-
Dimention: it's normally category (text) data to describe such information as device, collection point, model. In the supertable template of TDengine, we use tag columns to store the dimention information. You can use SQL like
select distinct tbname, tag1, tag2 from supertableto get dimentions. -
Metric: quantitive (numeric) fileds that can be calculated, like SUM, AVERAGE, MINIMUM. If the collecting frequency is 1 second, then there are 31,536,000 records in one year, it will be too low efficient to import so big data into Power BI. In TDengine, you can use data partition query, window partition query, in combination with pseudo columns related to window, to import downsampled data into Power BI. For more details, please refer to TDengine Specialized Queries。
-
Window partition query: for example, thermal meters collect one data per second, but you need to query the average temperature every 10 minutes, you can use window subclause to get the downsampling data you need. The corresponding SQL is like
select tbname, _wstart date,avg(temperature) temp from table interval(10m), in which _wstart is a pseudo column indicting the start time of a widow, 10m is the duration of the window,avg(temperature)indicates the aggregate value inside a window. -
Data partition query: If you want to get the aggregate value of a lot of thermal meters, you can first partition the data and then perform a series of calculation in the partitioned data spaces. The SQL you need to use is
partition by part_list. The most common of data partition usage is that when querying a supertable, you can partition data by subtable according to tags to form the data of each subtable into a single time serie to facilitate analytical processing of time series data.
-
Time Serie: When curve plotting or aggregating data based on time lines, date is normally required. Data or time can be imported from Excel, or retrieved from TDengine using SQL statement like
select _wstart date, count(*) cnt from test.meters where ts between A and B interval(1d) fill(0), in which the fill() subclause indicates the fill mode when there is data missing, pseudo column _wstart indicates the date to retrieve. -
Correlation: Indicates how to correlate data. Dimentions and Metrics can be correlated by tbname, dates and metrics can be correlated by date. All these can cooperate to form visual reports.
Example - Meters
TDengine has its own specific data model, which uses supertable as template and creates a specific table for each device. Each table can have maximum 4,096 data columns and 128 tags. In the example of meters , assume each meter generates one record per second, then there will be 86,400 records each day and 31,536,000 records every year, then only 1,000 meters will occupy 500GB disk space. So, the common usage of Power BI should be mapping tags to dimension columns, mapping the aggregation of data columns to metric columns, to provide indicators for decision makers.
- Import Dimensions: Import the tags of tables in PowerBI, and name as "tags", the SQL is as the following:
select distinct tbname, groupid, location from test.meters; - Import Metrics: In Power BI, import the average current, average voltage, average phase with 1 hour window, and name it as "data", the SQL is as the following:
select tbname, _wstart ws, avg(current), avg(voltage), avg(phase) from test.meters PARTITION by tbname interval(1h); - Correlate Dimensions and Metrics: In Power BI, open model view, correlate "tags" and "data", and set "tabname" as the correlation column, then you can use the data in histogram, pie chart, etc. For more information about building visual reports in PowerBI, please refer to Power BI.