Grafana
TDengine can be quickly integrated with the open-source data visualization system Grafana to build a data monitoring and alerting system. The whole process does not require any code development. And you can visualize the contents of the data tables in TDengine on a dashboard. You can learn more about using the TDengine plugin on GitHub.
Prerequisites
In order for Grafana to add the TDengine data source successfully, the following preparations are required:
- Grafana server is installed and running properly. TDengine currently supports Grafana versions 7.5 and above. Users can go to the Grafana official website to download the installation package and execute the installation according to the current operating system. The download address is as follows: https://grafana.com/grafana/download.
- The TDengine cluster is deployed and functioning properly
- taosAdapter is installed and running properly. Please refer to the taosAdapter manual for details.
Record these values:
- TDengine REST API url:
http://tdengine.local:6041. - TDengine cluster authorization, with user + password.
Install Grafana Plugin and Configure Data Source
- With GUI
- With Script
- Install & Configure Manually
- Container
Under Grafana 8, plugin catalog allows you to browse and manage plugins within Grafana (but for Grafana 7.x, use With Script or Install & Configure Manually). Find the page at Configurations > Plugins, search TDengine and click it to install.
Installation may cost some minutes, you can Create a TDengine data source when installation finished. Then you can add a TDengine data source by filling up the configuration options.
- Host: IP address of the server where the components of the TDengine cluster provide REST service and the port number of the TDengine REST service (6041), by default use
http://localhost:6041. - User: TDengine user name.
- Password: TDengine user password.
Click Save & Test to test. You should see a success message if the test worked.
You can create dashboards with TDengine now.
On a server with Grafana installed, run install.sh with TDengine url and username/passwords will install TDengine data source plugin and add a data source named TDengine. This is the recommended way for Grafana 7.x or Grafana provisioning users.
bash -c "$(curl -fsSL \
  https://raw.githubusercontent.com/taosdata/grafanaplugin/master/install.sh)" -- \
  -a http://localhost:6041 \
  -u root \
  -p taosdata
Restart Grafana service and open Grafana in web-browser, usually http://localhost:3000.
Save the script and type ./install.sh --help for the full usage of the script.
Follow the installation steps in Grafana with the grafana-cli command-line tool for plugin installation.
grafana-cli plugins install tdengine-datasource
# with sudo
sudo -u grafana grafana-cli plugins install tdengine-datasource
You can also download zip files from GitHub or Grafana and install manually. The commands are as follows:
GF_VERSION=3.5.2
# from GitHub
wget https://github.com/taosdata/grafanaplugin/releases/download/v$GF_VERSION/tdengine-datasource-$GF_VERSION.zip
# from Grafana
wget -O tdengine-datasource-$GF_VERSION.zip https://grafana.com/api/plugins/tdengine-datasource/versions/$GF_VERSION/download
Take CentOS 7.2 for example, extract the plugin package to /var/lib/grafana/plugins directory, and restart grafana.
sudo unzip tdengine-datasource-$GF_VERSION.zip -d /var/lib/grafana/plugins/
If Grafana is running in a Docker environment, the TDengine plugin can be automatically installed and set up using the following environment variable settings:
GF_INSTALL_PLUGINS=tdengine-datasource
Now users can log in to the Grafana server (username/password: admin/admin) directly through the URL http://localhost:3000 and add a datasource through Configuration -> Data Sources on the left side.
Click Add data source to enter the Add data source page, and enter TDengine in the query box to add it.
Enter the datasource configuration page, and follow the default prompts to modify the corresponding configuration.
- Host: IP address of the server where the components of the TDengine cluster provide REST service and the port number of the TDengine REST service (6041), by default use
http://localhost:6041. - User: TDengine user name.
- Password: TDengine user password.
Click Save & Test to test. You should see a success message if the test worked.
Please refer to Install plugins in the Docker container. This will install tdengine-datasource plugin when Grafana container starts:
docker run -d \
  -p 3000:3000 \
  --name=grafana \
  -e "GF_INSTALL_PLUGINS=tdengine-datasource" \
  grafana/grafana
You can setup a zero-configuration stack for TDengine + Grafana by docker-compose and Grafana provisioning file:
-
Save the provisioning configuration file to
tdengine.yml.apiVersion: 1
datasources:
- name: TDengine
type: tdengine-datasource
orgId: 1
url: "$TDENGINE_API"
isDefault: true
secureJsonData:
url: "$TDENGINE_URL"
basicAuth: "$TDENGINE_BASIC_AUTH"
token: "$TDENGINE_CLOUD_TOKEN"
version: 1
editable: true -
Write
docker-compose.ymlwith TDengine and Grafana image.version: "3.7"
services:
tdengine:
image: tdengine/tdengine:3.3.0.0
environment:
TAOS_FQDN: tdengine
volumes:
- tdengine-data:/var/lib/taos/
grafana:
image: grafana/grafana:9.3.6
volumes:
- ./tdengine.yml/:/etc/grafana/provisioning/tdengine.yml
- grafana-data:/var/lib/grafana
environment:
# install tdengine plugin at start
GF_INSTALL_PLUGINS: "tdengine-datasource"
TDENGINE_URL: "http://tdengine:6041"
#printf "$TDENGINE_USER:$TDENGINE_PASSWORD" | base64
TDENGINE_BASIC_AUTH: "cm9vdDp0YmFzZTEyNQ=="
ports:
- 3000:3000
volumes:
grafana-data:
tdengine-data: -
Start TDengine and Grafana services:
docker-compose up -d.
Open Grafana (http://localhost:3000), and you can add dashboard with TDengine now.
In the following introduction, we take Grafana v11.0.0 as an example. Other versions may have different features, please refer to Grafana's official website.
Built-in Variables and Custom Variables
The Variable feature in Grafana is very powerful. It can be used in queries, panel titles, labels, etc., to create more dynamic and interactive Dashboards, improving user experience and efficiency.
The main functions and characteristics of variables include:
-
Dynamic data query: Variables can be used in query statements, allowing users to dynamically change query conditions by selecting different variable values, thus viewing different data views. This is very useful for scenarios that need to dynamically display data based on user input.
-
Improved reusability: By defining variables, the same configuration or query logic can be reused in multiple places without the need to rewrite the same code. This makes the maintenance and updating of Dashboards simpler and more efficient.
-
Flexible configuration options: Variables offer a variety of configuration options, such as predefined static value lists, dynamic value querying from data sources, regular expression filtering, etc., making the application of variables more flexible and powerful.
Grafana provides both built-in variables and custom variables, which can be referenced in SQL writing. We can use $variableName to reference the variable, where variableName is the name of the variable. For detailed reference, please refer to Variable reference.
Built-in Variables
Grafana has built-in variables such as from, to, and interval, all derived from Grafana plugin panels. Their meanings are as follows:
fromis the start time of the query rangetois the end time of the query rangeintervalrepresent time spans
It is recommended to set the start and end times of the query range for each query, which can effectively reduce the amount of data scanned by the TDengine server during query execution. interval is the size of the window split, which in Grafana version 11, is calculated based on the time range and the number of return points.
In addition to the above three common variables, Grafana also provides variables such as __timezone, __org, __user, etc. For details, please refer to Built-in Variables.
Custom Variables
We can add custom variables in the Dashboard. The usage of custom variables is no different from that of built-in variables; they are referenced in SQL with $variableName.
Custom variables support multiple types, such as Query, Constant, Interval, Data source, etc.
Custom variables can reference other custom variables, for example, one variable represents a region, and another variable can reference the value of the region to query devices in that region.
Adding Query Type Variables
In the Dashboard configuration, select Variables, then click New variable:
- In the
Namefield, enter your variable name, here we set the variable name asselected_groups. - In the
Select variable typedropdown menu, selectQuery. Depending on the selected variable type, configure the corresponding options. For example, if you chooseQuery, you need to specify the data source and the query statement for obtaining variable values. Here, taking smart meters as an example, we set the query type, select the data source, and configure the SQL asselect distinct(groupid) from power.meters where groupid < 3 and ts > $from and ts < $to; - After clicking
Run Queryat the bottom, you can see the variable values generated based on your configuration in thePreview of valuessection. - Other configurations are not detailed here. After completing the configuration, click the
Applybutton at the bottom of the page, then clickSave dashboardin the top right corner to save.
After completing the above steps, we have successfully added a new custom variable $selected_groups to the Dashboard. We can later reference this variable in the Dashboard's queries with $selected_groups.
We can also add another custom variable to reference this selected_groups variable, for example, we add a query variable named tbname_max_current, with the SQL as select tbname from power.meters where groupid = $selected_groups and ts > $from and ts < $to;
Adding Interval Type Variables
We can customize the time window interval to better fit business needs.
- In the
Namefield, enter the variable name asinterval. - In the
Select variable typedropdown menu, selectInterval. - In the
Interval optionsenter1s,2s,5s,10s,15s,30s,1m. - Other configurations are not detailed here. After completing the configuration, click the
Applybutton at the bottom of the page, then clickSave dashboardin the top right corner to save.
After completing the above steps, we have successfully added a new custom variable $interval to the Dashboard. We can later reference this variable in the Dashboard's queries with $interval.
TDengine Time Series Query Support
On top of supporting standard SQL, TDengine also provides a series of special query syntaxes that meet the needs of time series business scenarios, bringing great convenience to the development of applications in time series scenarios.
partition bythis clause can split data by certain dimensions and then perform a series of calculations within the split data space, which can replacegroup byin most cases.intervalthis clause is used to generate time windows of the same time interval.fillthis clause is used to specify how to fill when there is data missing in any window.Window PseudocolumnsIf you need to output the time window information corresponding to the aggregation result in the results, you need to use window pseudocolumns in the SELECT clause: the start time of the time window (_wstart), the end time of the time window (_wend), etc.
For a detailed introduction to these features, please refer to Time-Series Extensions.
Create Dashboard
Return to the main interface to create a Dashboard, click Add Query to enter the panel query page:
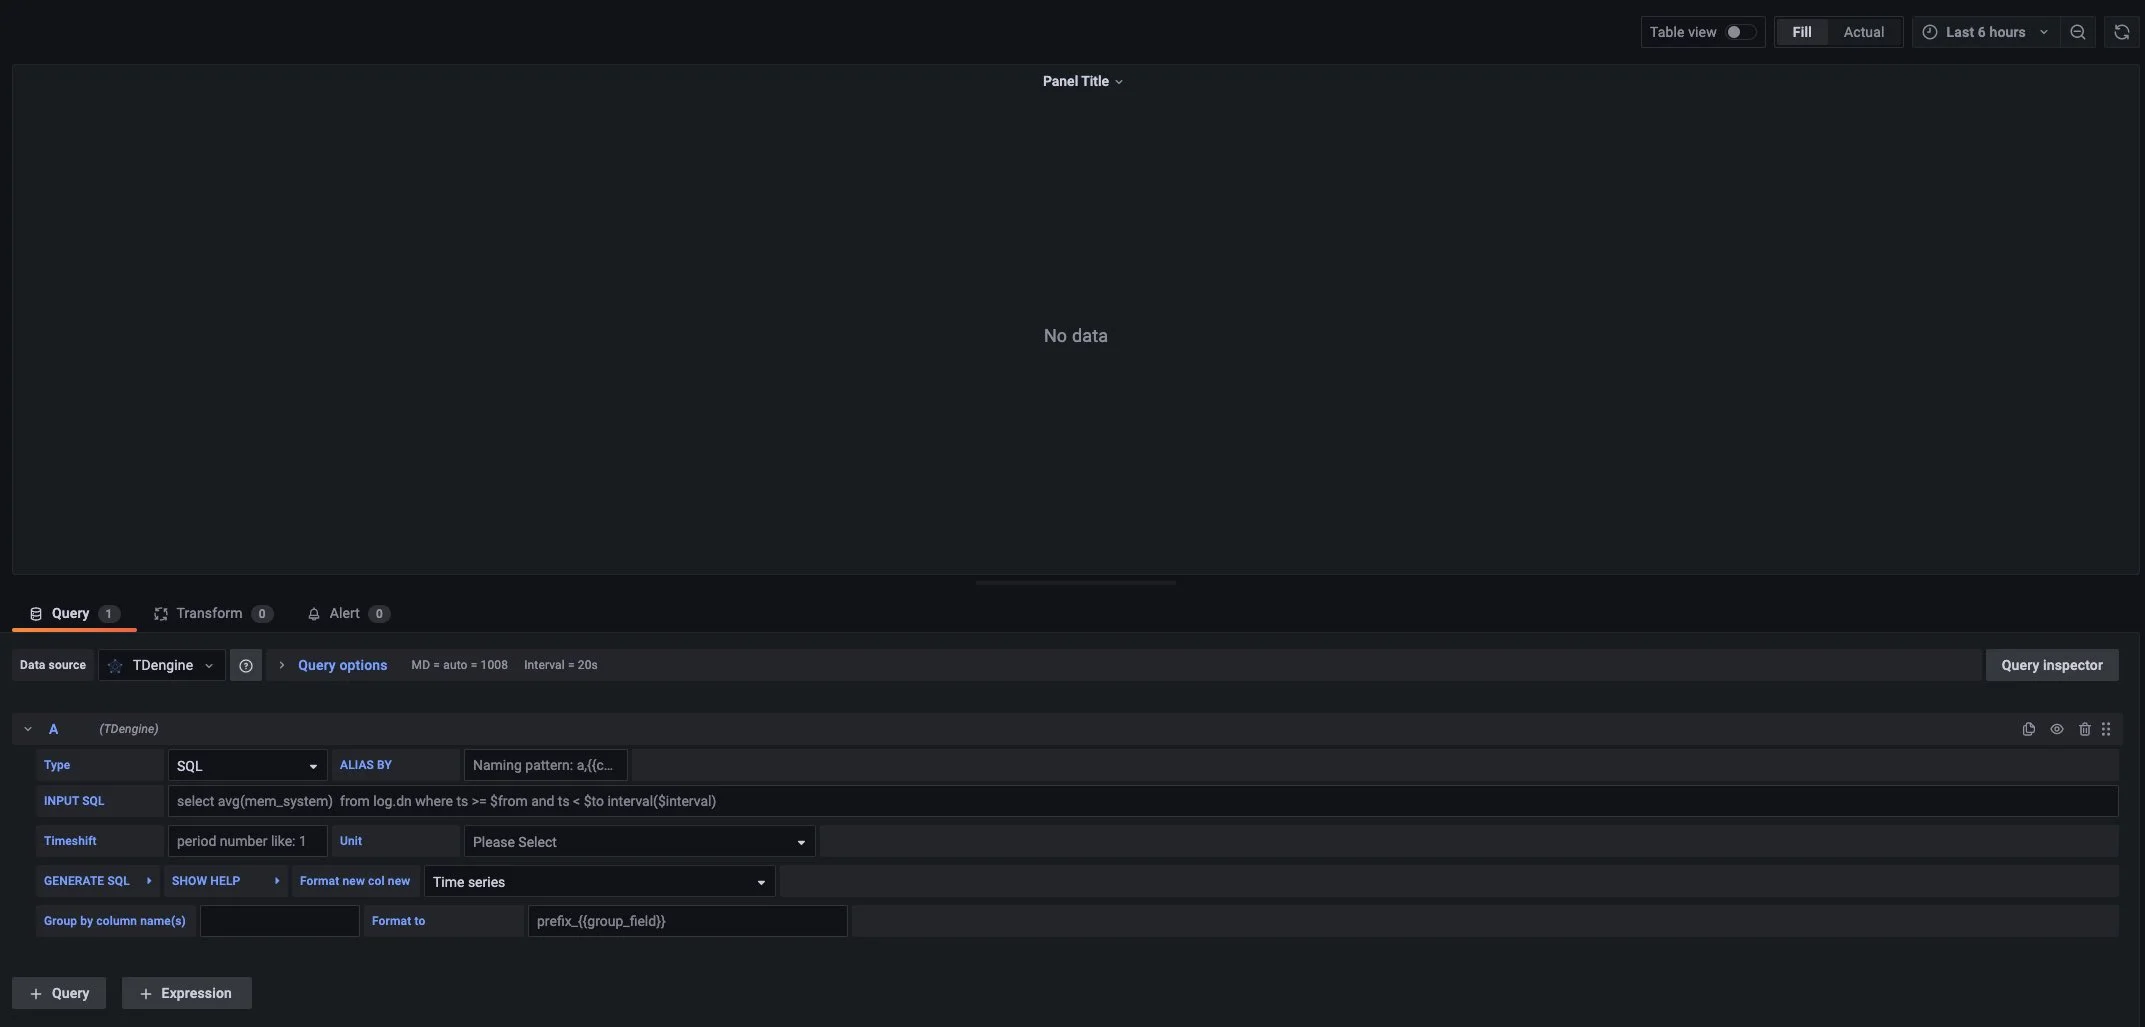
As shown above, select the TDengine data source in the Query and enter the corresponding SQL in the query box below for query. We will continue to use power meters as an example. In order to demonstrate the beautiful curves, virtual data is used here.
Time Series Data Display
Suppose we want to query the average current size over a period of time, with the time window divided by $interval, and fill with null if data is missing in any time window interval.
- INPUT SQL: Enter the statement to be queried (the result set of this SQL statement should be two columns and multiple rows), here enter:
select _wstart as ts, avg(current) as current from power.meters where groupid in ($selected_groups) and ts > $from and ts < $to interval($interval) fill(null), where from, to, and interval are built-in variables of the Grafana, selected_groups is a custom variable. - ALIAS BY: You can set the current query alias.
- GENERATE SQL: Clicking this button will automatically replace the corresponding variables and generate the final execution statement.
In the custom variables at the top, if the value of selected_groups is selected as 1, then the query for the average value change of all device currents in the meters supertable where groupid is 1 is as shown in the following figure:
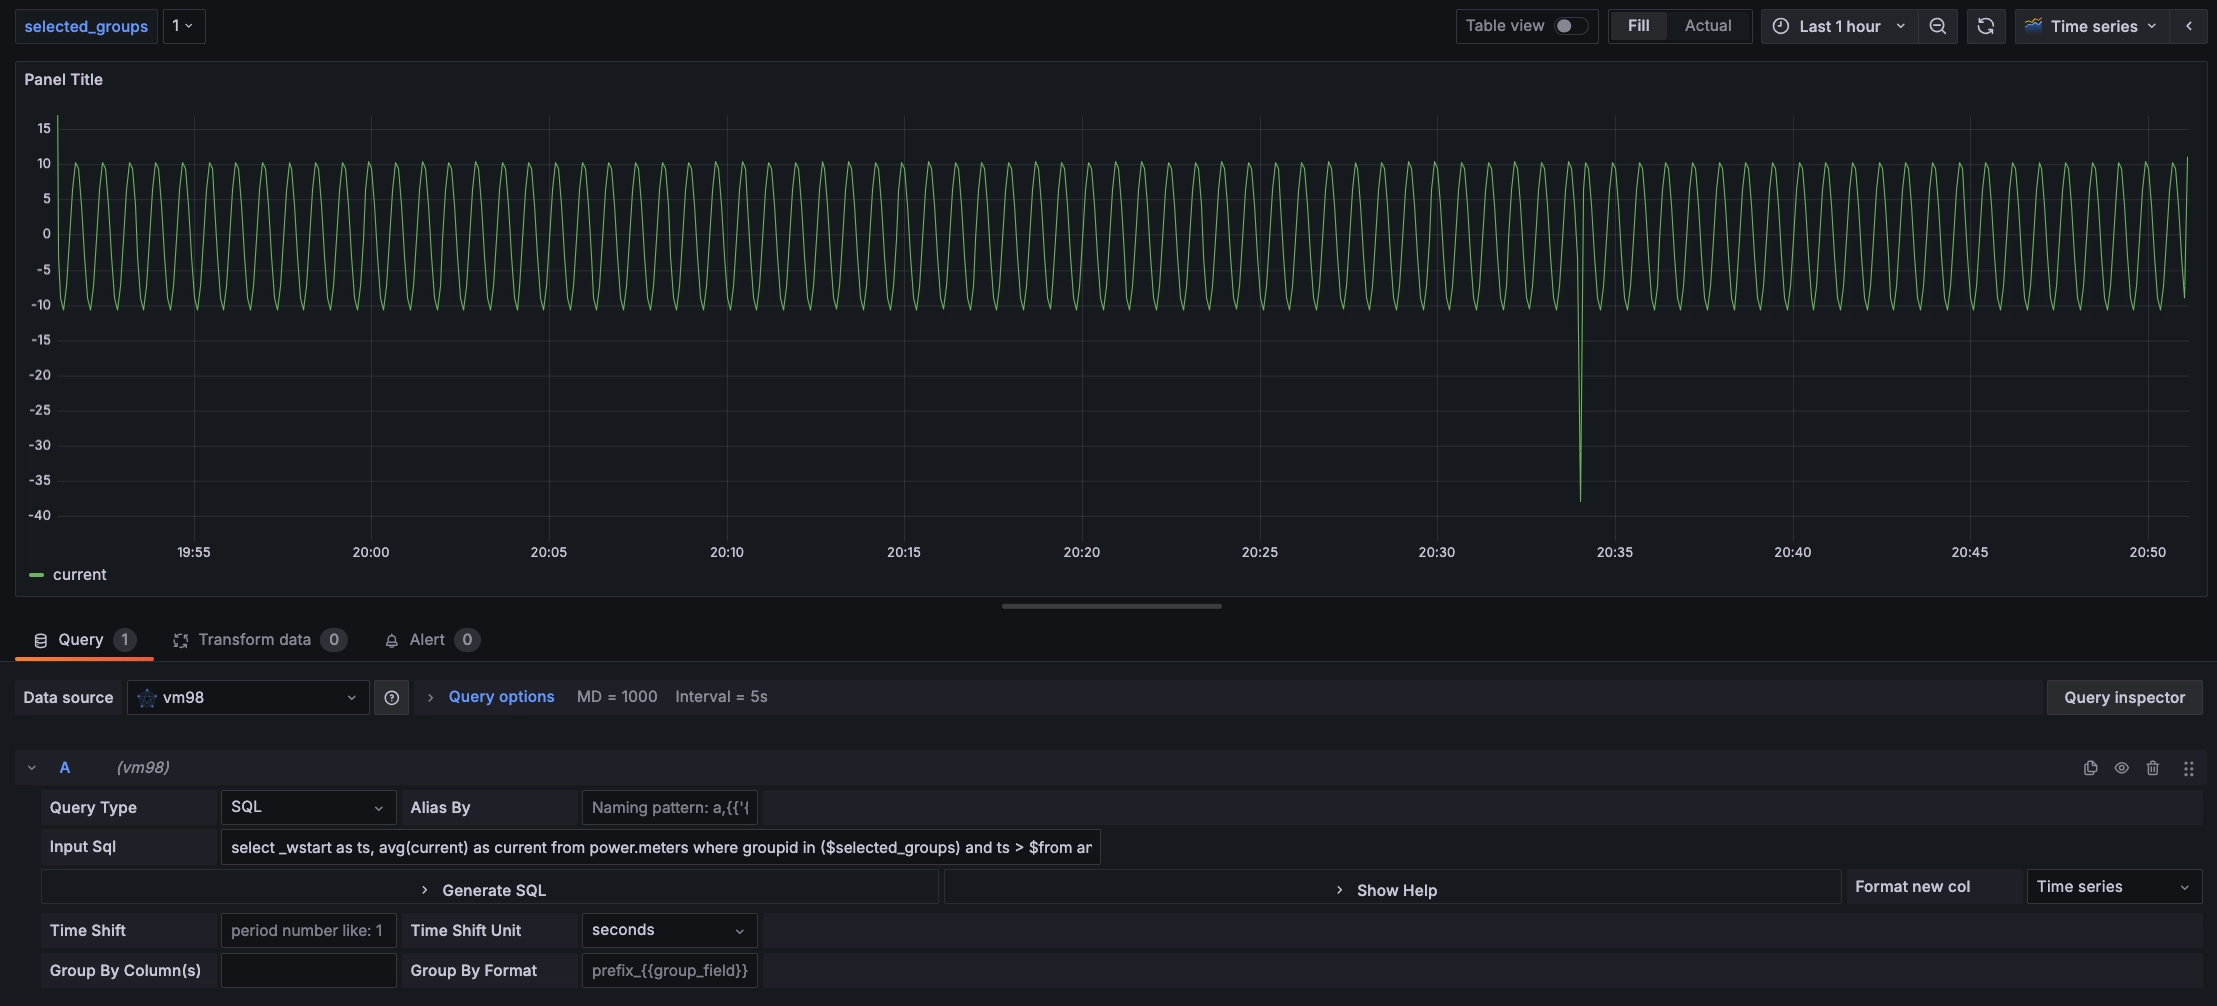
Since the REST interface is stateless, it is not possible to use the use db statement to switch databases. In the SQL statement in the Grafana plugin, you can use <db_name>.<table_name> to specify the database.
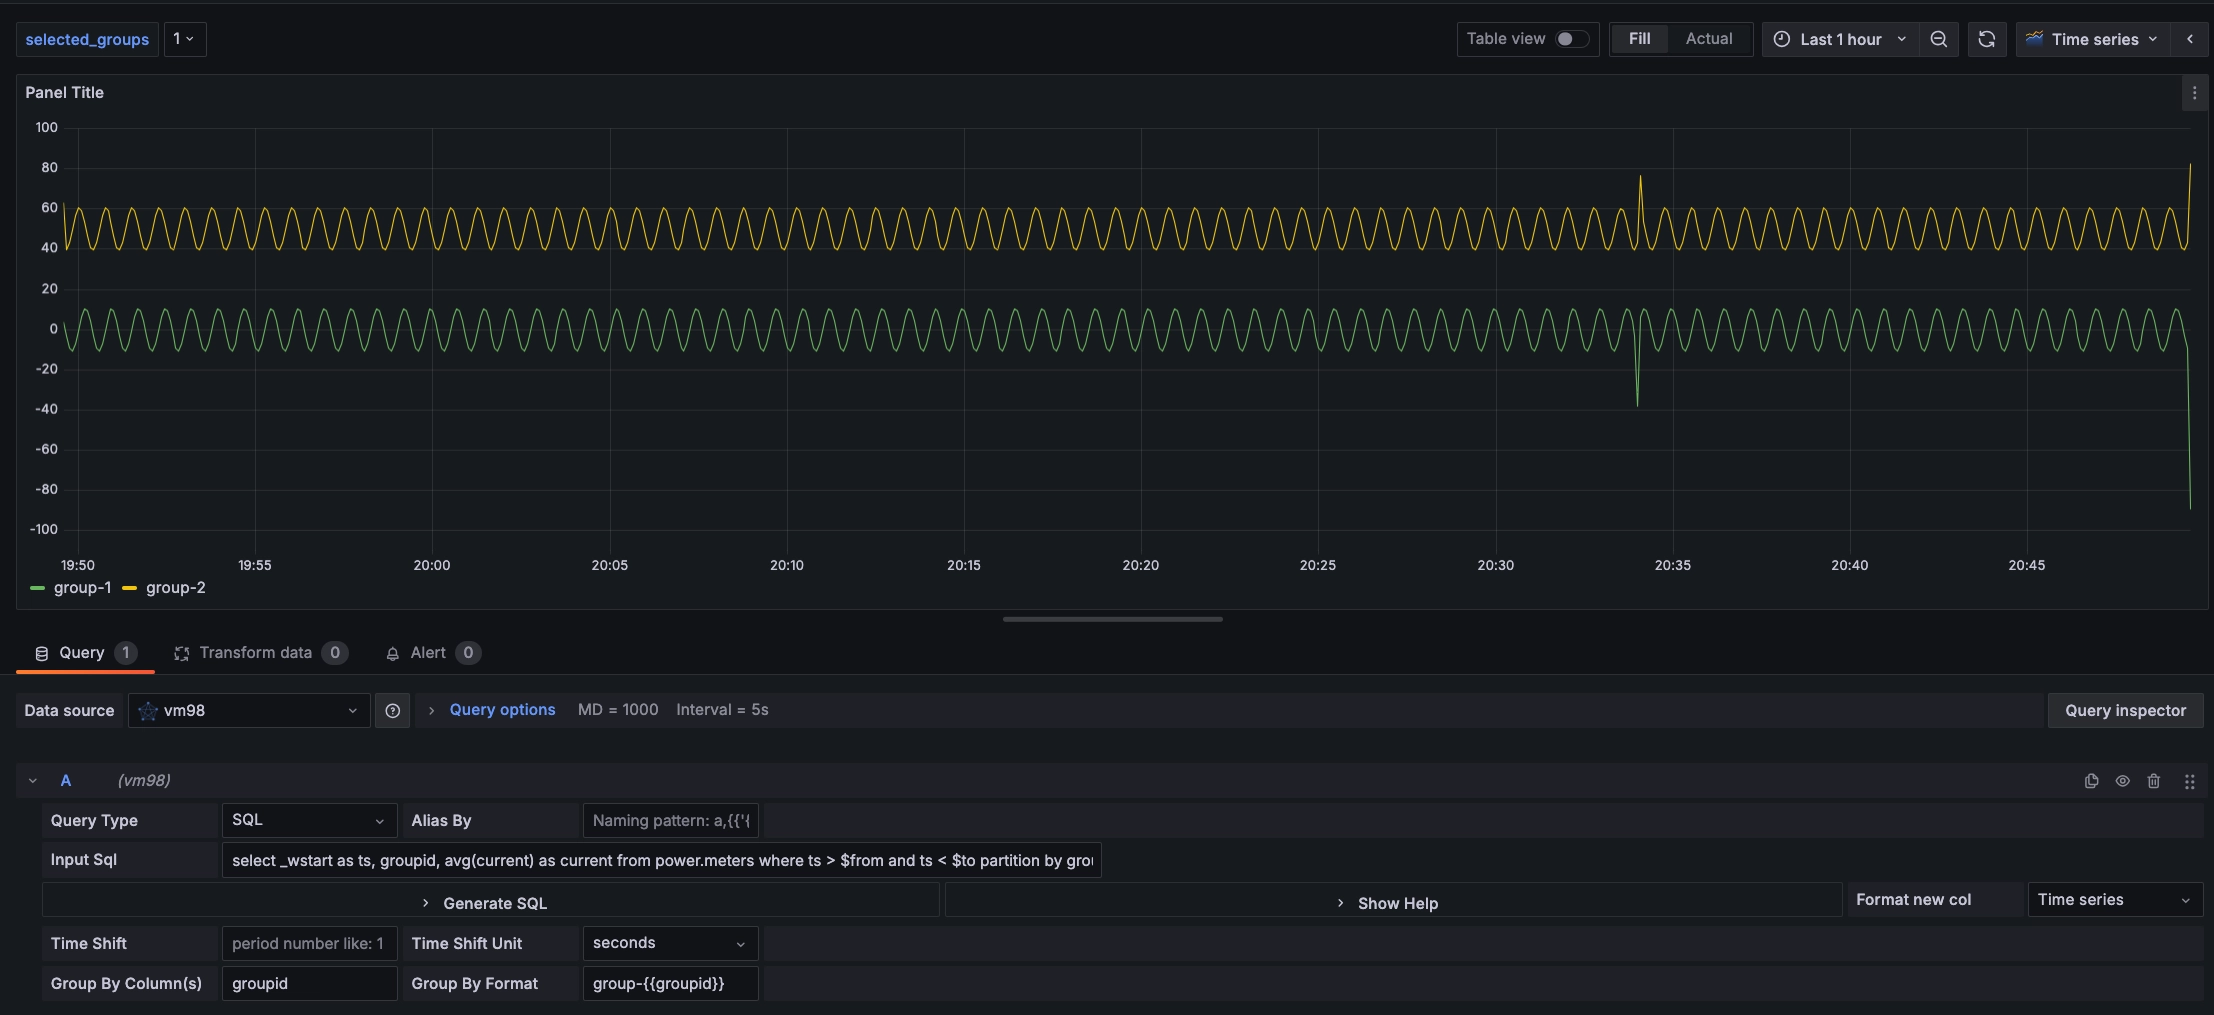
Time Series Data Group Display
Suppose we want to query the average current value over a period of time, displayed by groupid grouping, we can modify the previous SQL to select _wstart as ts, groupid, avg(current) as current from power.meters where ts > $from and ts < $to partition by groupid interval($interval) fill(null)
- Group by column(s): Half-width comma-separated
group byorpartition bycolumn names. If it is agroup byorpartition byquery statement, setting theGroup bycolumn can display multidimensional data. Here, set the Group by column name togroupid, which can display data grouped bygroupid. - Group By Format: Legend formatting format for multidimensional data in Group by or Partition by scenarios. For example, the above INPUT SQL, setting
Group By Formattogroupid-{{groupid}}, the displayed legend name is the formatted group name.
After completing the settings, the data is displayed grouped by groupid as shown in the following figure:
For more information on how to use Grafana to create the appropriate monitoring interface and for more details on using Grafana, refer to the official Grafana documentation.
Performance Suggestions
- Include time range in all queries, in time series databases, if the time range is not included in the query, it will lead to table scanning and poor performance. A common SQL writing example is
select column_name from db.table where ts > $from and ts < $to; - For queries of the latest status type, we generally recommend enabling cache when creating the database (
CACHEMODELset to last_row or both), a common SQL writing example isselect last(column_name) from db.table where ts > $from and ts < $to;
Importing the Dashboard
You can install TDinsight dashboard in data source configuration page (like http://localhost:3000/datasources/edit/1/dashboards) as a monitoring visualization tool for TDengine cluster. Ensure that you use TDinsight for 3.x. Please note TDinsight for 3.x needs to configure and run taoskeeper correctly.

A dashboard for TDengine 2.x has been published on Grafana: Dashboard 15167 - TDinsight.
For more dashboards using TDengine data source, search here in Grafana. Here is a sub list:
- 15146: Monitor multiple TDengine clusters.
- 15155: TDengine alert demo.
- 15167: TDinsight.
- 16388: Telegraf node metrics dashboard using TDengine data source.
Alert Configuration Introduction
Alert Configuration Steps
The TDengine Grafana plugin supports alerts. To configure alerts, the following steps are required:
- Configure Contact Points: Set up notification channels, including DingDing, Email, Slack, WebHook, Prometheus Alertmanager, etc.
- Configure Notification Policies: Set up routing for which channel to send alerts to, as well as the timing and frequency of notifications.
- Configure "Alert rules": Set up detailed alert rules.
3.1 Configure alert name.
3.2 Configure query and alert trigger conditions.
3.3 Configure evaluation behavior.
3.4 Configure labels and notifications.
3.5 Configure annotations.
Alert Configuration Web UI
In Grafana 11, the alert Web UI has 6 tabs: "Alert rules", "Contact points", "Notification policies", "Silences", "Groups", and "Settings".
- "Alert rules" displays and configures alert rules.
- "Contact points" support notification channels such as DingDing, Email, Slack, WebHook, Prometheus Alertmanager, etc.
- "Notification policies" sets up routing for which channel to send alerts to, as well as the timing and frequency of notifications.
- "Silences" configures silent periods for alerts.
- "Groups" displays grouped alerts after they are triggered.
- "Admin" allows modifying alert configurations through JSON.
Configuring Email Contact Point
Modifying Grafana Server Configuration File
Add SMTP/Emailing and Alerting modules to the Grafana service configuration file. For Linux systems, the configuration file is usually located at /etc/grafana/grafana.ini.
Add the following content to the configuration file:
#################################### SMTP / Emailing ##########################
[smtp]
enabled = true
host = smtp.qq.com:465      #Email service used
user = receiver@foxmail.com
password = ***********      #Use mail authorization code
skip_verify = true
from_address = sender@foxmail.com
Then restart the Grafana service. For example, on a Linux system, execute systemctl restart grafana-server.service
Grafana Configuration for Email Contact Point
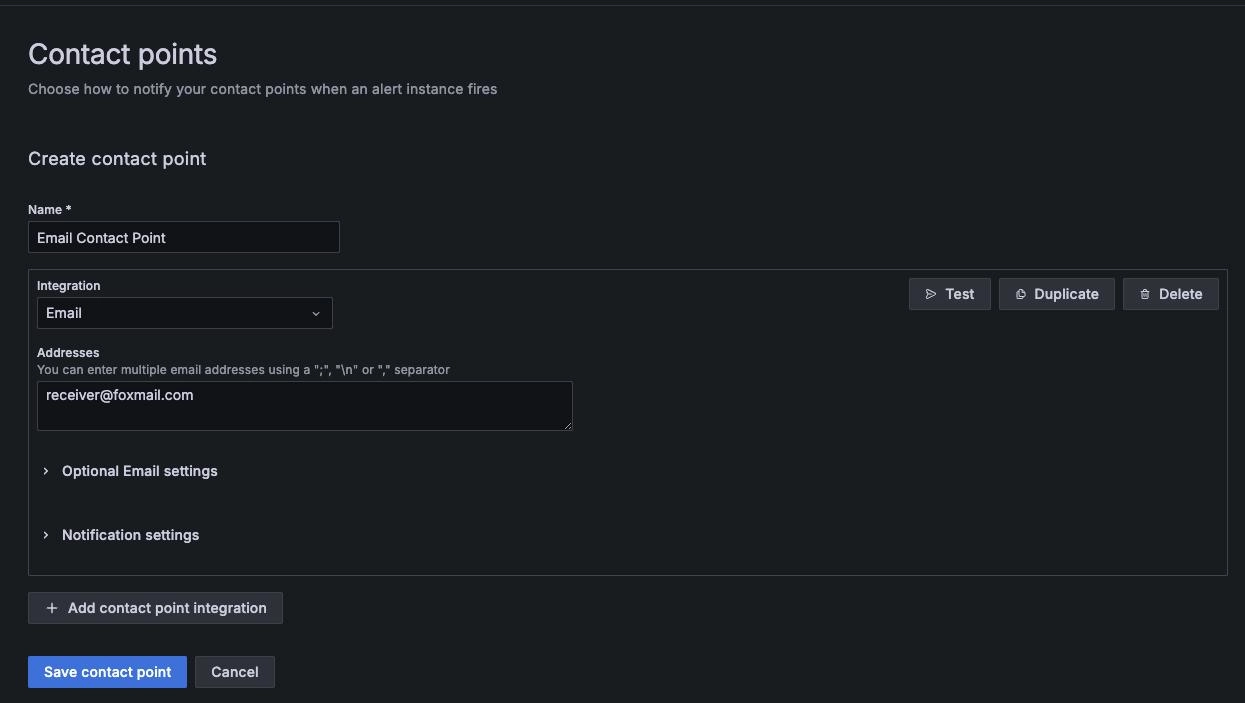
Find "Home" -> "Alerting" -> "Contact points" on the Grafana page to create a new contact point
"Name": Email Contact Point
"Integration": Select the contact type, here choose Email, fill in the email receiving address, and save the contact point after completion
Configuring Feishu Contact Point
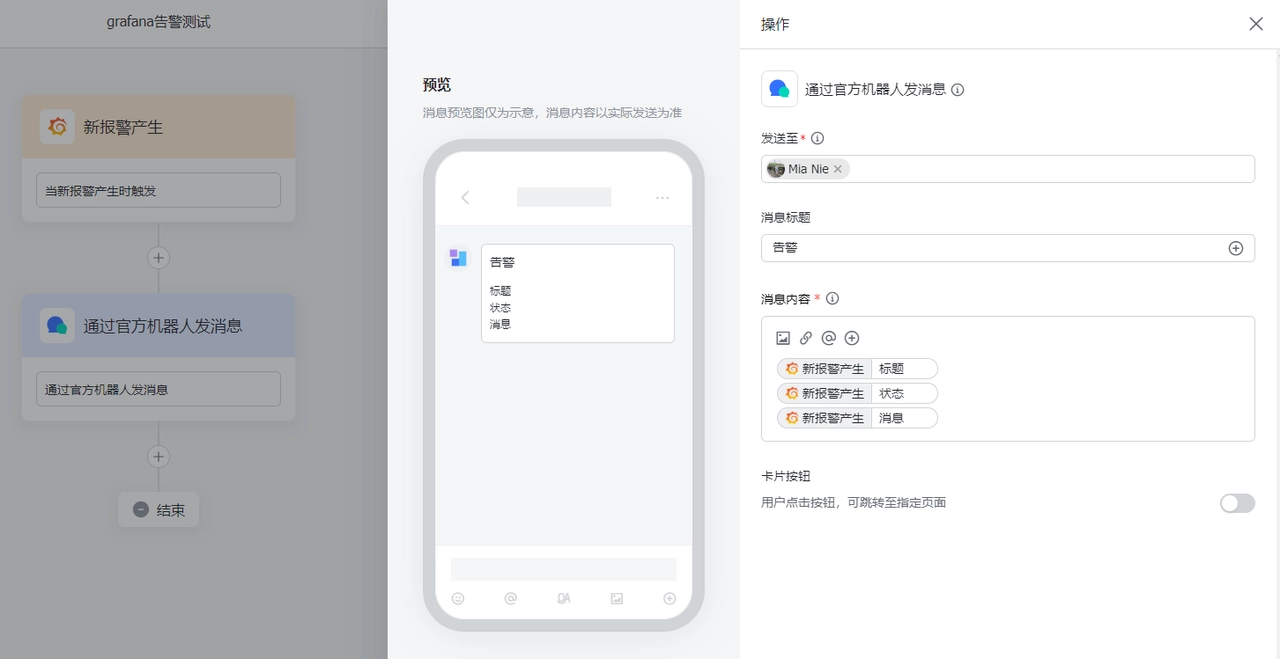
Feishu Robot Configuration
- "Feishu Workspace" -> "Get Apps" -> "Search for Feishu Robot Assistant" -> "Create Command"
- Choose Trigger: Grafana
- Choose Action: Send a message through the official robot, fill in the recipient and message content
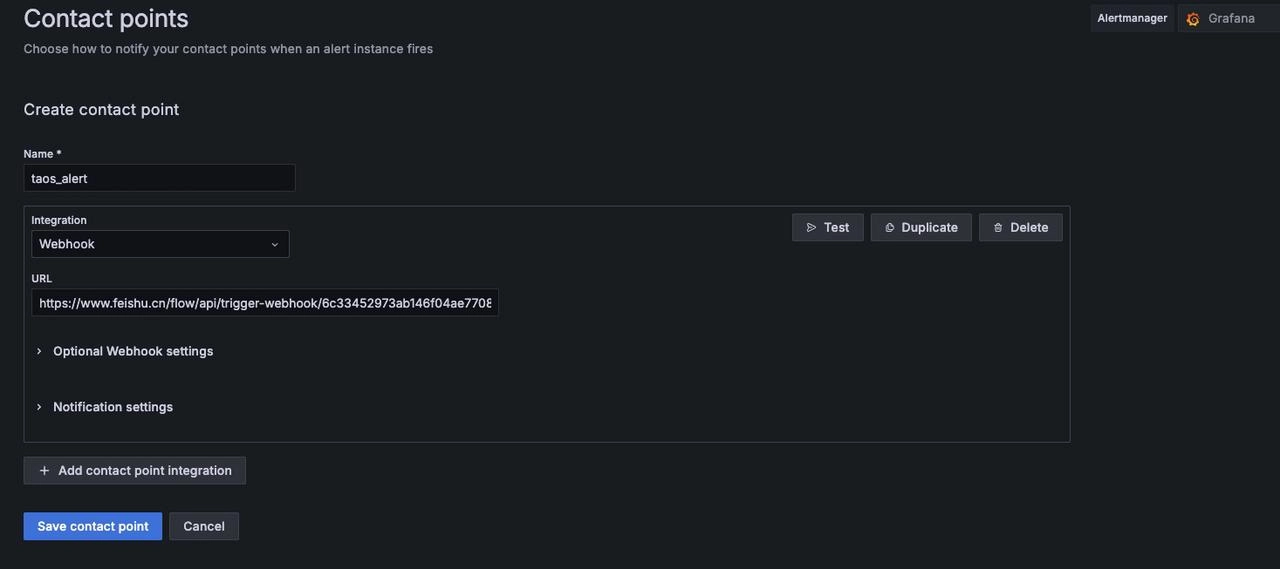
Grafana Configuration for Feishu Contact Point
Find "Home" -> "Alerting" -> "Contact points" on the Grafana page to create a new contact point
"Name": Feishu Contact Point
"Integration": Select the contact type, here choose Webhook, and fill in the URL (the Grafana trigger Webhook address in Feishu Robot Assistant), then save the contact point
Notification Policy
After configuring the contact points, you can see there is a Default Policy
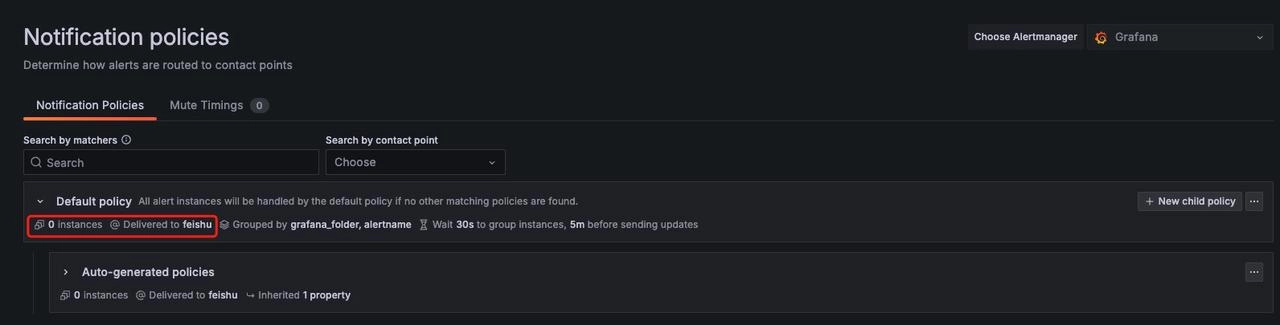
Click on the "..." on the right -> "Edit", then edit the default notification policy, a configuration window pops up:
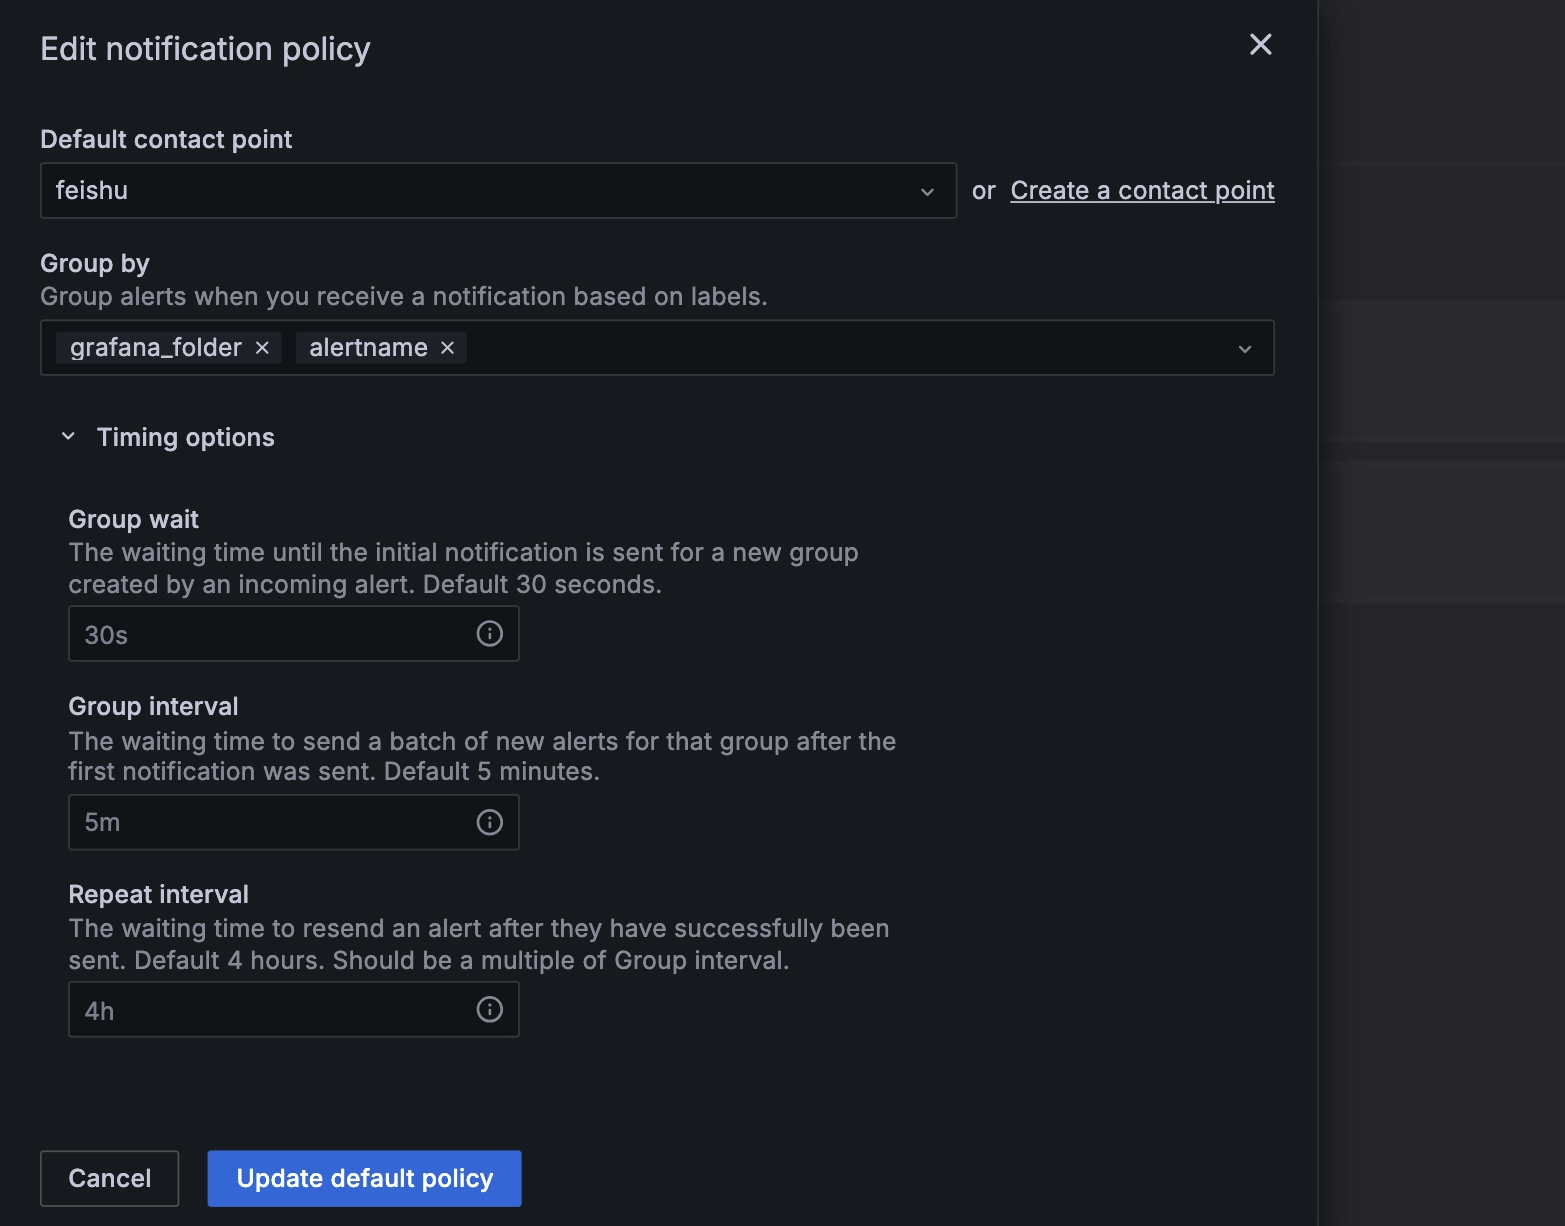
Configure the parameters as shown in the screenshot above.
Configuring Alert Rules
Define Query and Alert Conditions
Select "Edit" -> "Alert" -> "New alert rule" in the panel where you want to configure the alert.
- "Enter alert rule name": Here, enter
power meters alertas an example for smart meters. - "Define query and alert condition":
2.1 Choose data source:TDengine Datasource
2.2 Query statement:2.3 Set "Expression":select _wstart as ts, groupid, avg(current) as current from power.meters where ts > $from and ts < $to partition by groupid interval($interval) fill(null)Threshold is above 100
2.4 Click "Set as alert condition"
2.5 "Preview": View the results of the set rules
After completing the settings, you can see the image displayed below:
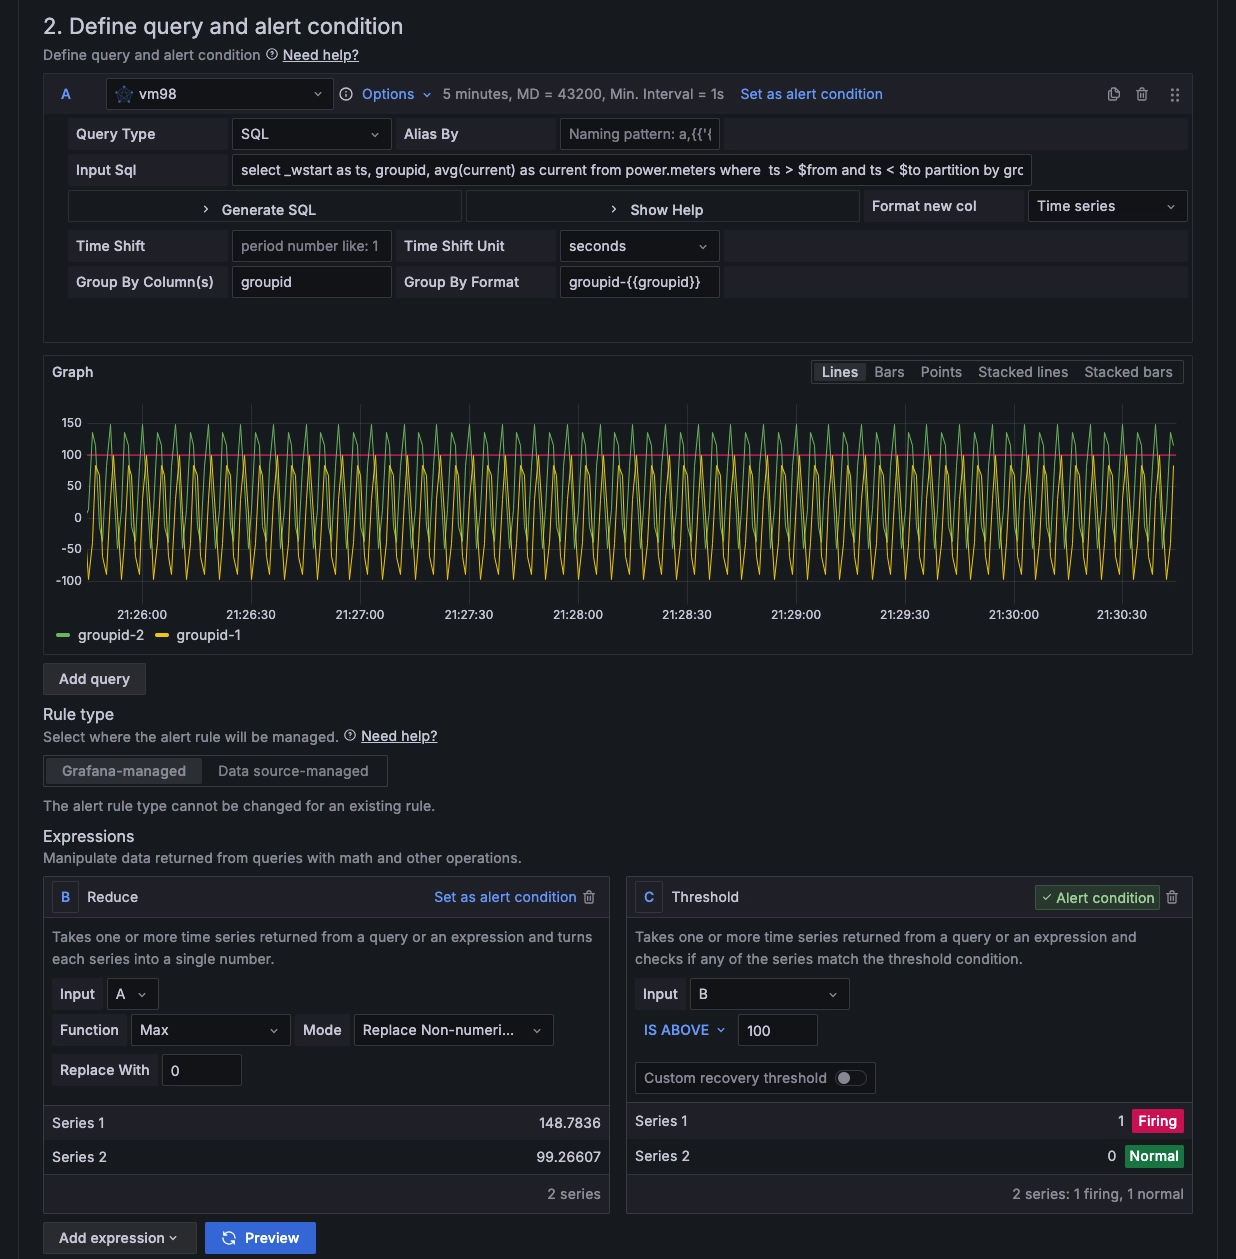
Configuring Expressions and Calculation Rules
Grafana's "Expression" supports various operations and calculations on data, which are divided into:
- "Reduce": Aggregates the values of a time series within the selected time range into a single value
1.1 "Function" is used to set the aggregation method, supporting Min, Max, Last, Mean, Sum, and Count.
1.2 "Mode" supports the following three:- "Strict": If no data is queried, the data will be assigned NaN.
- "Drop Non-numeric Value": Remove illegal data results.
- "Replace Non-numeric Value": If it is illegal data, replace it with a constant value.
- "Threshold": Checks whether the time series data meets the threshold judgment condition. Returns 0 when the condition is false, and 1 when true. Supports the following methods:
- Is above (x > y)
- Is below (x < y)
- Is within range (x > y1 AND x < y2)
- Is outside range (x < y1 AND x > y2)
- "Math": Performs mathematical operations on the data of the time series.
- "Resample": Changes the timestamps in each time series to have a consistent interval, so that mathematical operations can be performed between them.
- "Classic condition (legacy)": Multiple logical conditions can be configured to determine whether to trigger an alert.
As shown in the screenshot above, here we set the alert to trigger when the maximum value exceeds 100.
Configuring Evaluation behavior
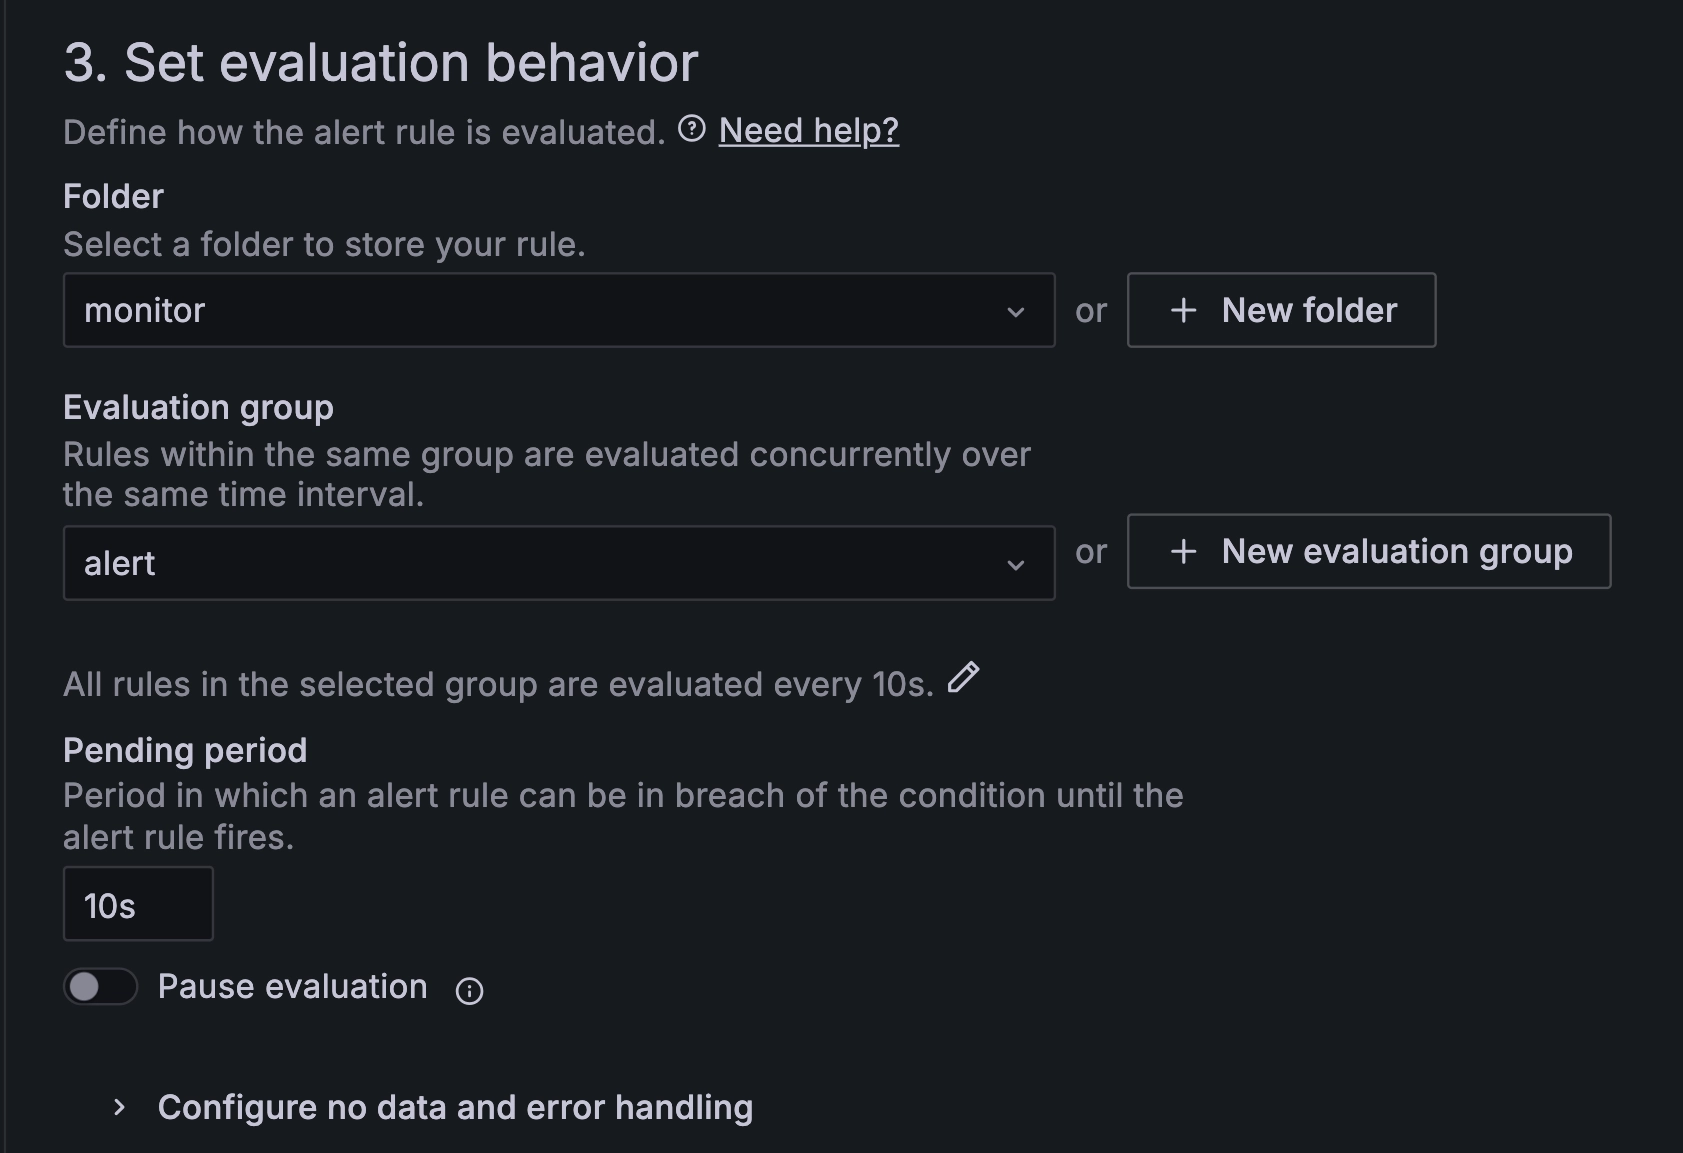
Configure the parameters as shown in the screenshot above.
Configuring Labels and Notifications
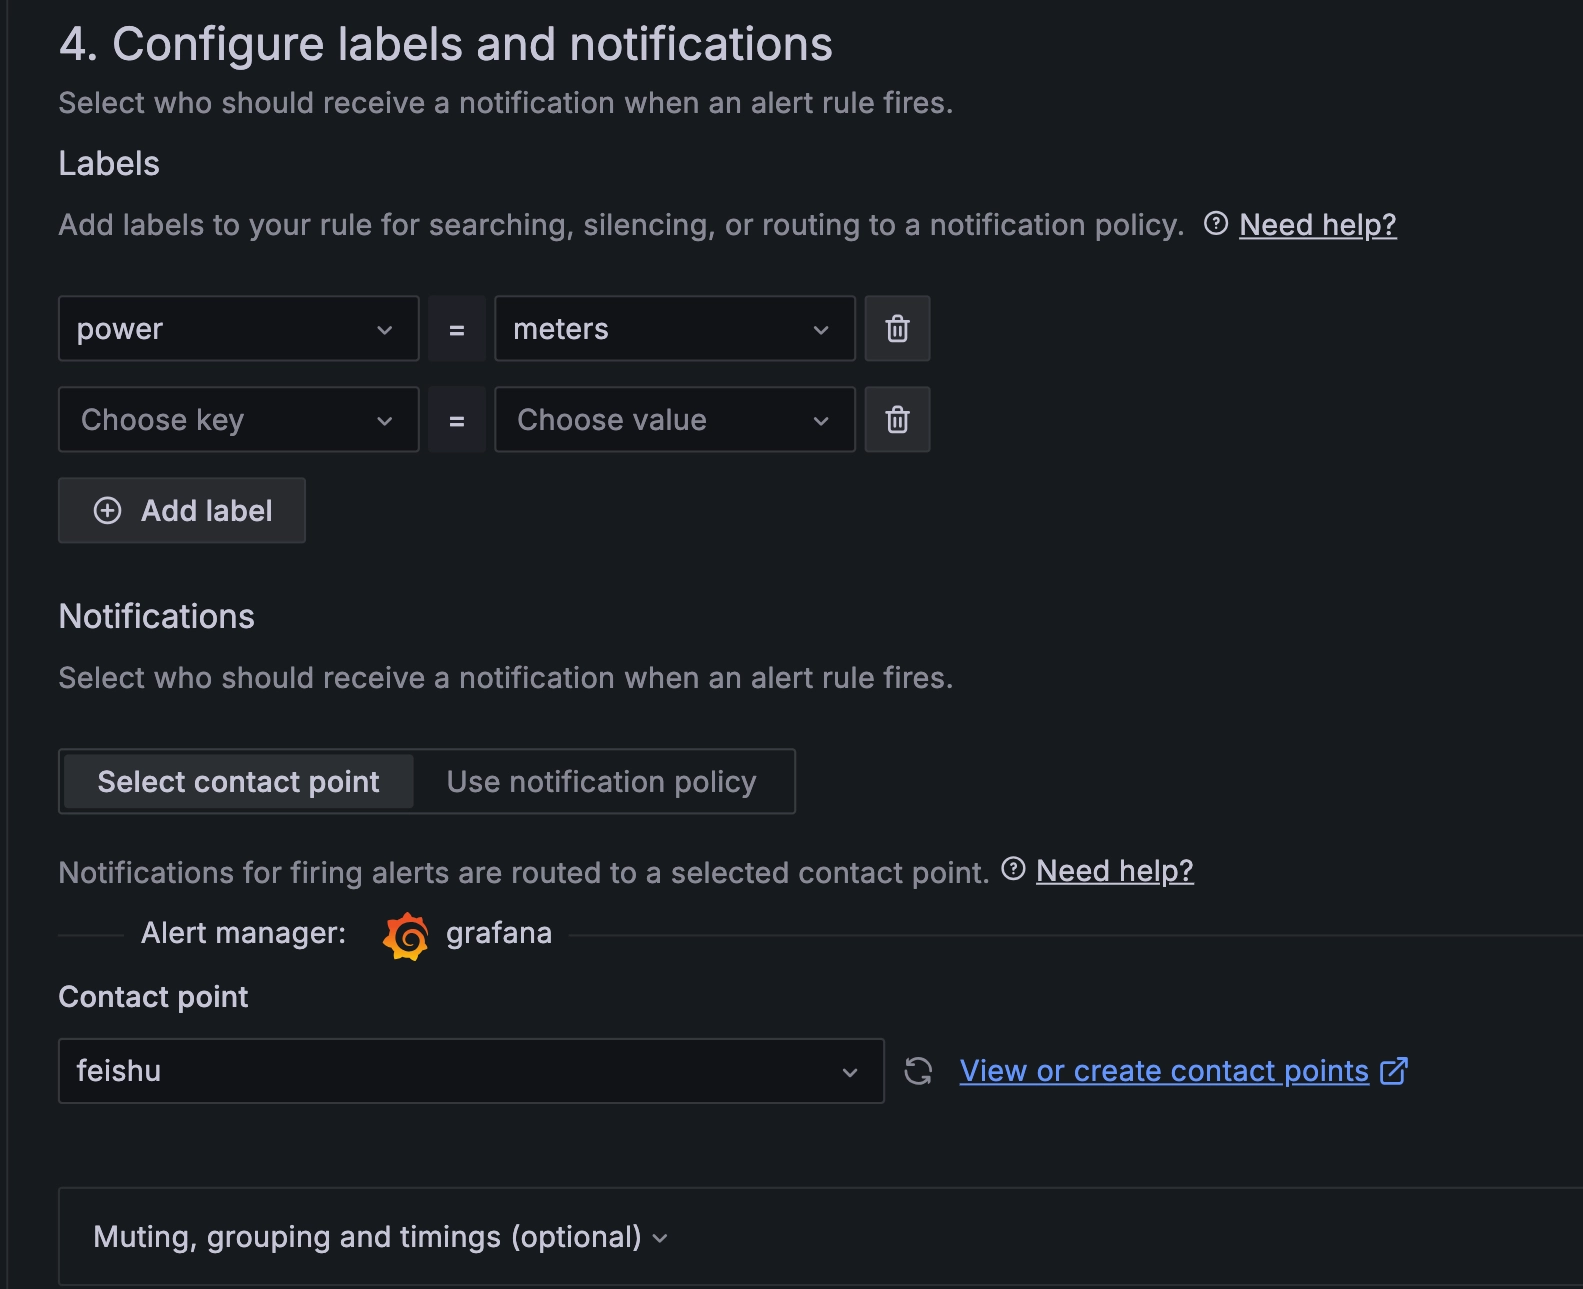
Configure the parameters as shown in the screenshot above.
Configuring annotations
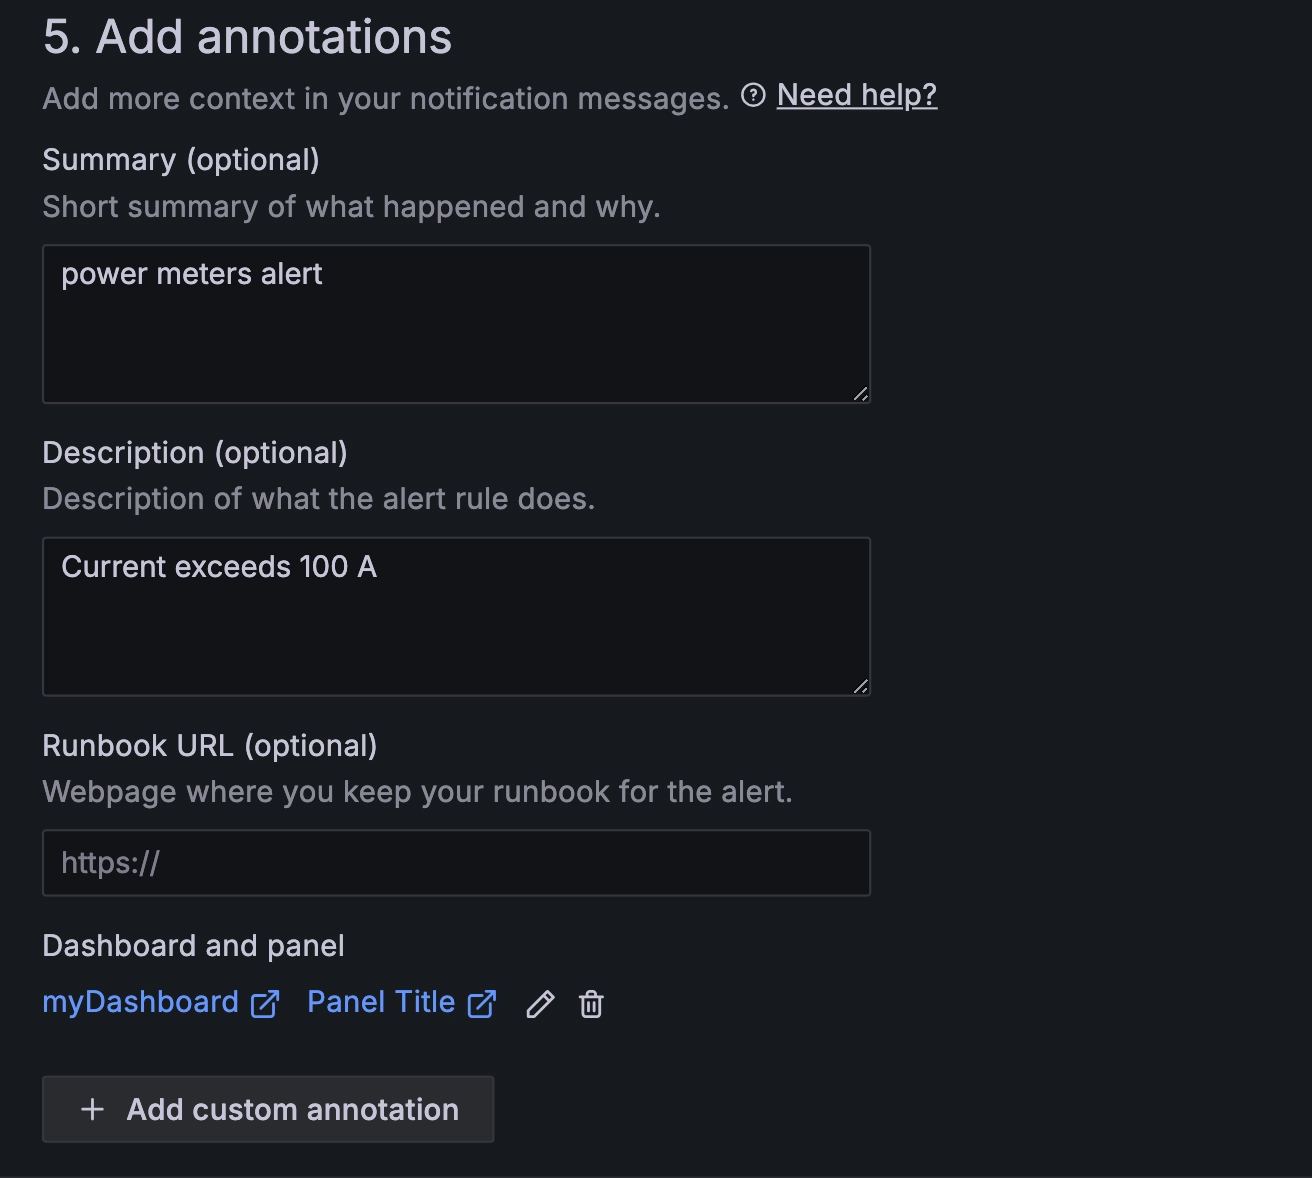
After setting "Summary" and "Description", you will receive an alert notification if the alert is triggered.