TDinsight Reference
TDinsight is a monitoring solution for TDengine using [Grafana].
TDengine writes information such as server CPU, memory, disk space, bandwidth, request count, disk read/write speed, and slow queries into a specified database periodically through taosKeeper. By using Grafana and the TDengine data source plugin, TDinsight visualizes cluster status, node information, insert and query requests, and resource usage, providing developers with the convenience to monitor the operational status of the TDengine cluster in real-time. This document will guide users on how to install the TDengine data source plugin and deploy the TDinsight visualization dashboard.
Prerequisites
First, check the following services:
-
TDengine is installed and running normally. This dashboard requires TDengine 3.0.0.0 or above, and monitoring reporting configuration enabled. For specific configurations, please refer to: TDengine Monitoring Configuration.
-
taosAdapter is installed and running normally. For details, please refer to: taosAdapter Reference Manual
-
taosKeeper is installed and running normally. For details, please refer to: taosKeeper Reference Manual
-
Grafana service is installed and running normally. We recommend using the latest version of Grafana, TDInsight supports Grafana 7.5 and above.
infoIn the following description, we use Grafana v11.0.0 as an example. Other versions may differ in functionality, please refer to Grafana Official Website.
Then record the following information:
- taosAdapter cluster REST API address, such as:
http://localhost:6041. - taosAdapter cluster authentication information, which can use username and password.
- taosKeeper database name for recording monitoring metrics.
Install TDengine Data Source Plugin and Configure Data Source
For steps on installing the Grafana TDengine data source plugin and configuring the data source, please refer to: Integration with Grafana
Import TDinsightV3 Dashboard
-
Recommended Method: After configuring the data source, click "Dashboards" next to "Settings" — this will display the dashboard built into the data source. Then select "Import" next to "TDengine for 3.x" to import it.

-
Import via Dashboard ID: On the left side of the Grafana main interface, click the "Dashboards" Tab, then select "Import" under the "New" option in the top right corner. Enter the Dashboard ID
18180for the "TDengine for 3.x" dashboard to complete the import. -
Import via JSON Configuration:
- First, download the JSON file from TDinsight for 3.x.
- On the left side of the Grafana main interface, click the "Dashboards" Tab, then select "Import" under the "New" option in the top right corner.
- In the "Import via dashboard JSON model" section, paste the content of the JSON file you just downloaded, then click "Import" to finish the import.
After successful import, you can access this dashboard. In the "Log from" option in the top left corner, select the database set in taosKeeper for recording monitoring metrics to view the monitoring results.
TDinsightV3 Dashboard Details
The TDinsight dashboard aims to provide information on the usage and status of TDengine-related resources, such as dnodes, mnodes, vnodes, and databases. It mainly includes Cluster Status, DNodes Overview, MNode Overview, Requests, Databases, DNode Resource Usage, and taosAdapter Monitoring Information. Below, we will explain each in detail.
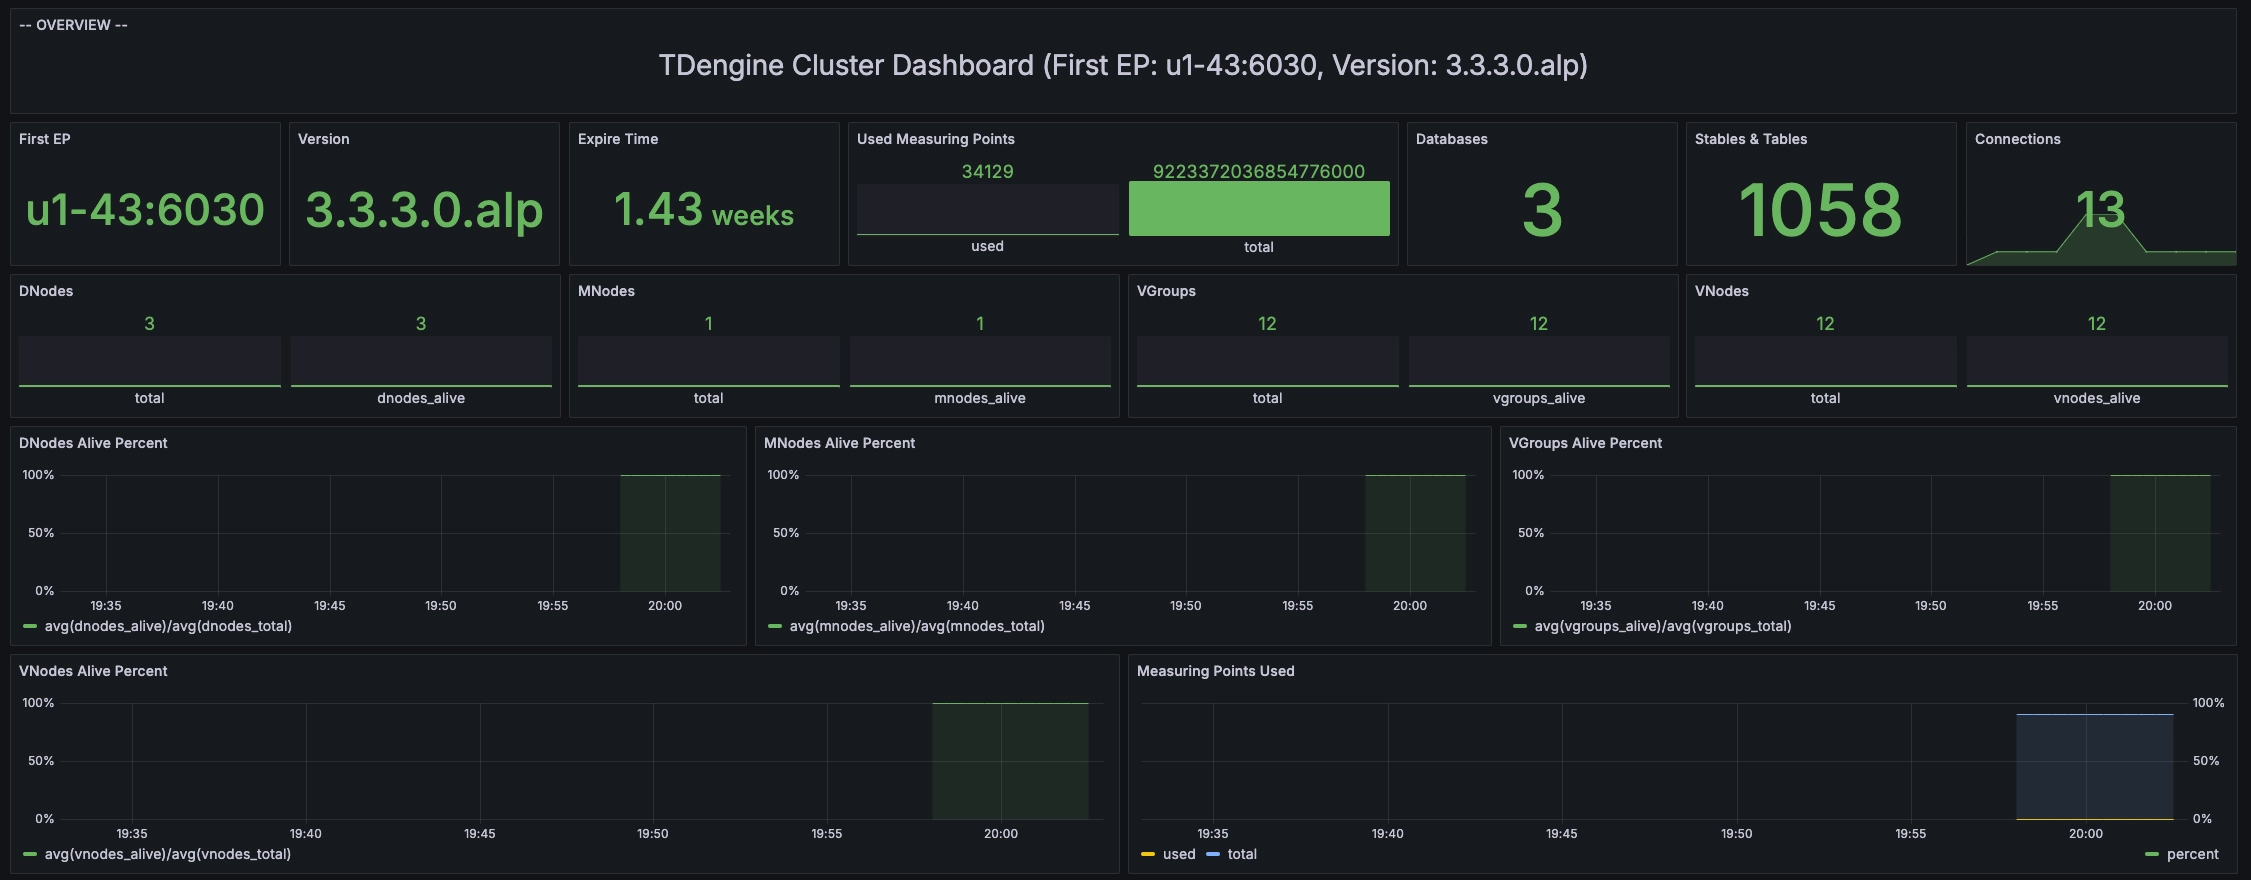
Cluster Status
This section includes current information and status of the cluster.

Metric details (from top to bottom, left to right):
- First EP: The
firstEpsetting in the current TDengine cluster. - Version: TDengine server version (master mnode).
- Expire Time - Expiration time for the TSDB-Enterprise.
- Used Measuring Points - Number of measuring points used in the TSDB-Enterprise.
- Databases - Number of databases.
- Connections - Current number of connections.
- DNodes/MNodes/VGroups/VNodes: Total and alive count of each resource.
- Classified Connection Counts: The current number of active connections, classified by user, application, and IP.
- DNodes/MNodes/VGroups/VNodes Alive Percent: The ratio of alive/total for each resource, enable alert rules, and trigger when the resource survival rate (average healthy resource ratio within 1 minute) is less than 100%.
- Measuring Points Used: Number of measuring points used with alert rules enabled (no data for TSDB-OSS, healthy by default).
DNodes Overview
This section includes basic information about the cluster's dnodes.

Metric details:
- DNodes Status: A simple table view of
show dnodes. - DNodes Number: Changes in the number of DNodes.
MNode Overview
This section includes basic information about the cluster's mnode.

Metric details:
- MNodes Status: A simple table view of
show mnodes. - MNodes Number: Similar to
DNodes Number, changes in the number of MNodes.
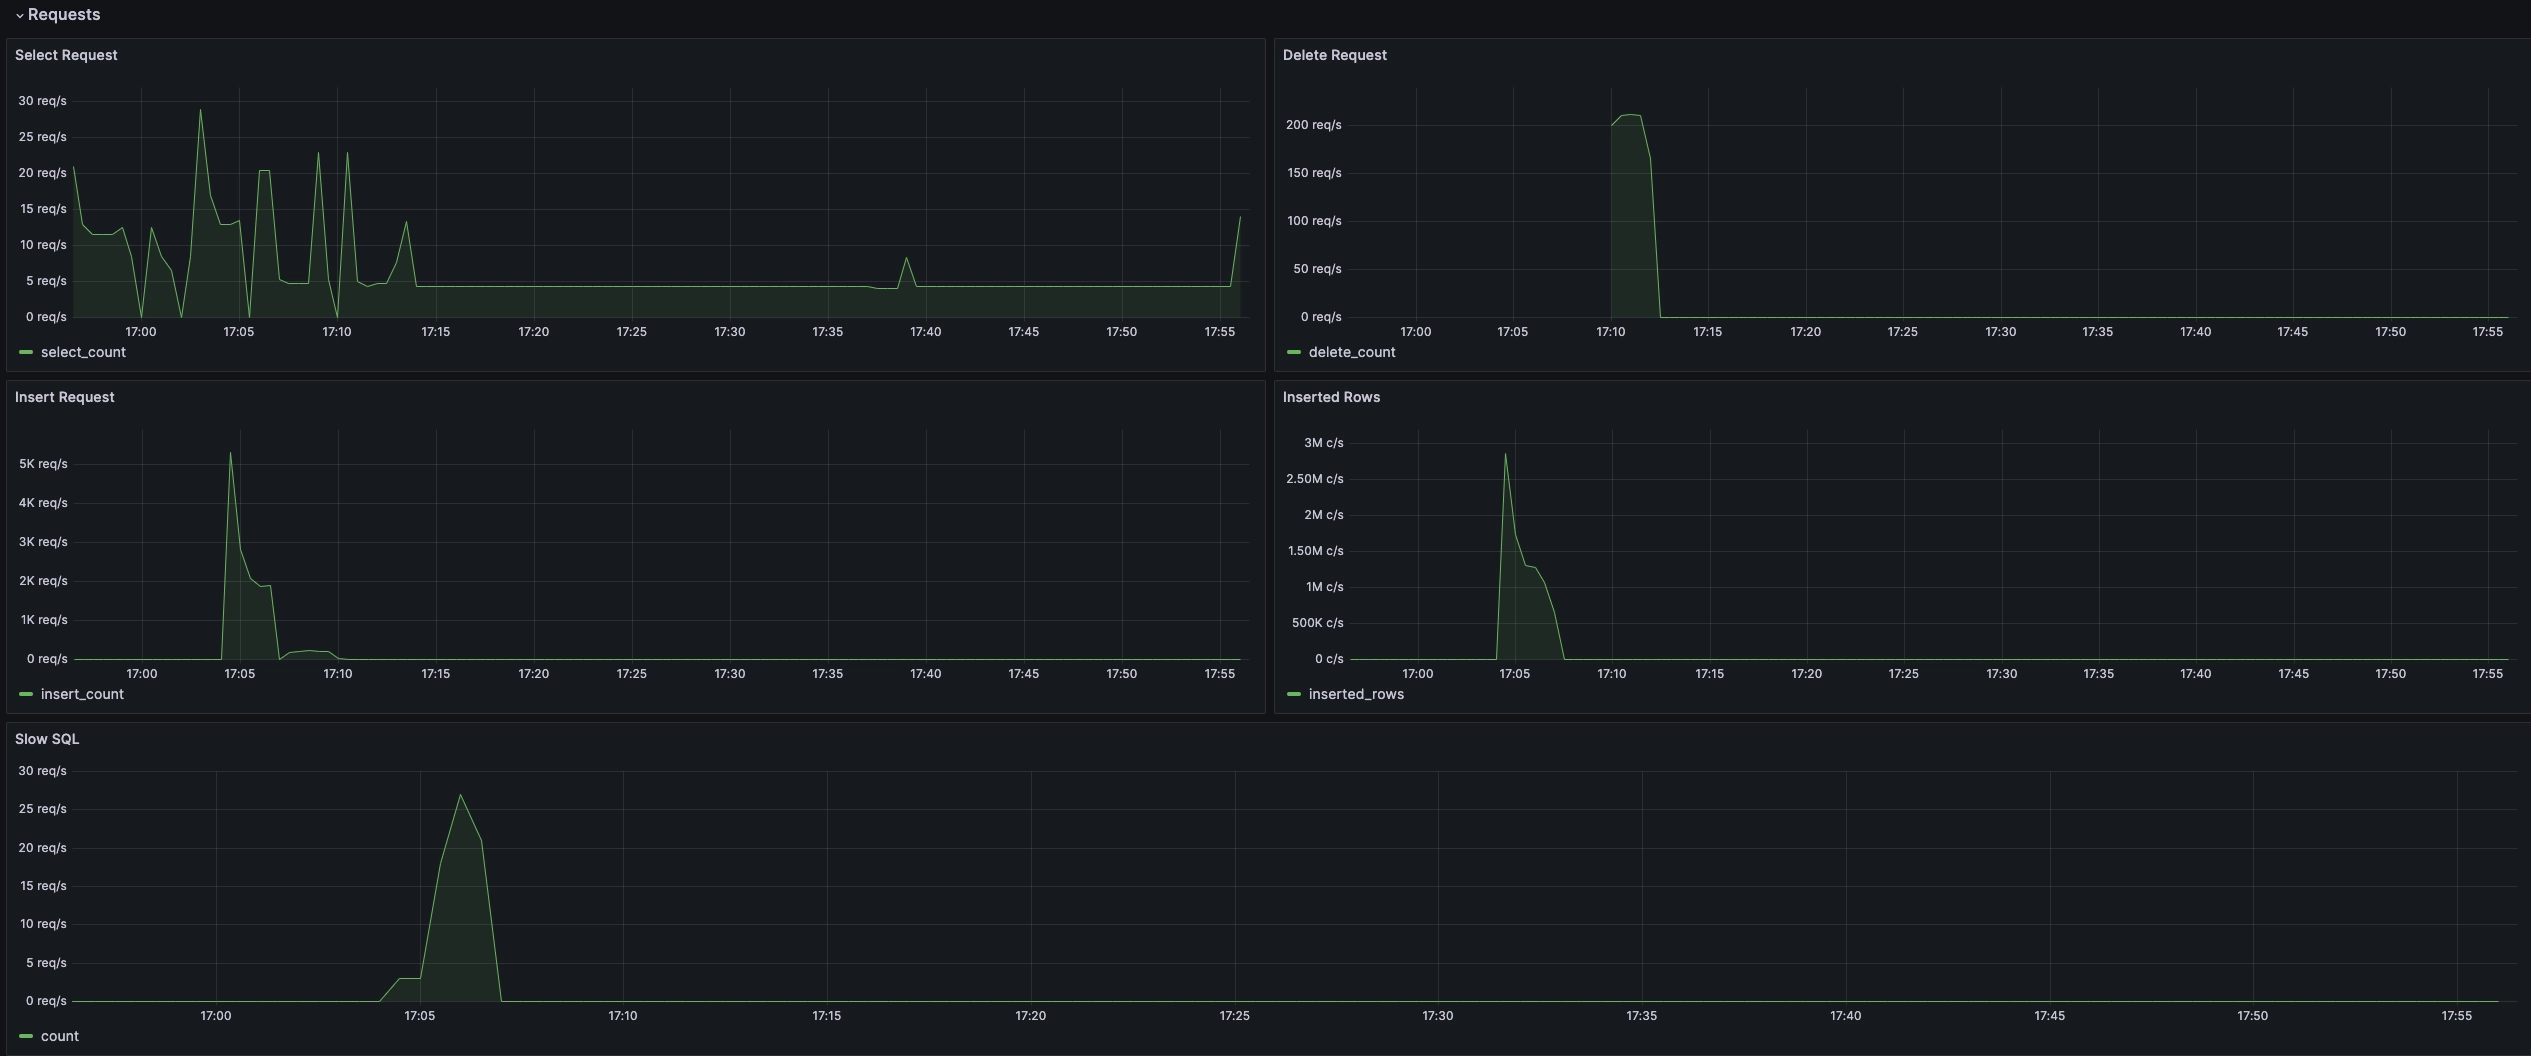
Request Statistics
This section includes statistical metrics for SQL execution in the cluster.

Metric details:
- Select Request: Number of select requests.
- Delete Request: Number of delete requests.
- Insert Request: Number of insert requests.
- Inserted Rows: Actual number of rows inserted.
- Slow Sql: Number of slow queries, which can be filtered by duration at the top.
Table Statistics
This section includes statistical metrics for tables in the cluster.

Metric details:
- STables: Number of supertables.
- Total Tables: Total number of tables.
- Tables: Time variation graph of all basic tables.
- Tables Number Foreach VGroups: Number of tables contained in each VGroup.
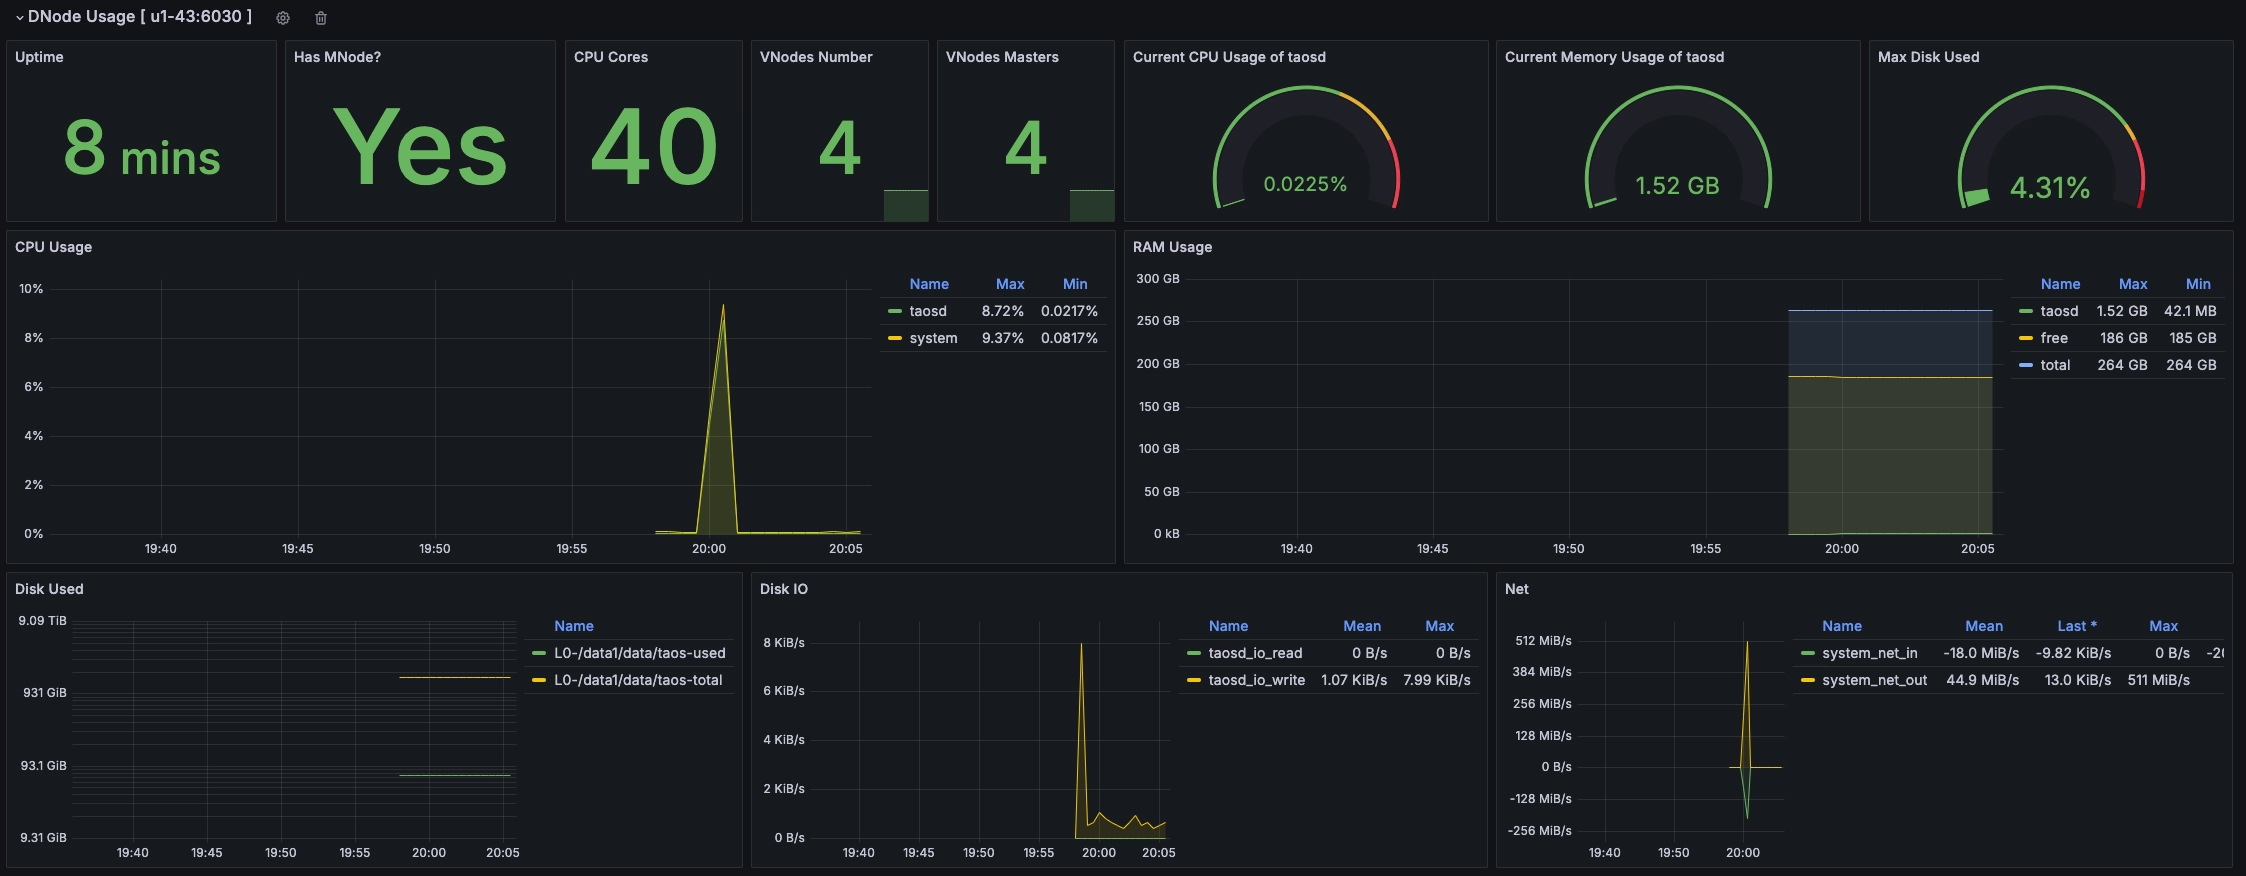
DNode Resource Usage
This section includes a display of resource usage for all data nodes in the cluster, with each data node shown as a Row.

Metric details (from top to bottom, left to right):
- Uptime: Time elapsed since the creation of the dnode.
- Has MNodes?: Whether the current dnode is an mnode.
- CPU Cores: Number of CPU cores.
- VNodes Number: Number of VNodes on the current dnode.
- VNodes Masters: Number of vnodes in the master role.
- Current CPU Usage of taosd: CPU usage rate of the taosd process.
- Current Memory Usage of taosd: Memory usage of the taosd process.
- Max Disk Used: Maximum disk usage rate for all data directories of taosd.
- CPU Usage: CPU usage rate of the process and system.
- RAM Usage: Time-Series view of RAM usage metrics.
- Disk Used: Disk used at each level under multi-level storage (default is level0).
- Disk IO: Disk IO rate.
- Net IO: Network IO, total network IO rate excluding local network.
taosAdapter Monitoring
This section includes detailed statistics for taosAdapter rest and websocket requests.

Metric details:
- Total: Total number of requests
- Successful: Total number of successful requests
- Failed: Total number of failed requests
- Queries: Total number of queries
- Writes: Total number of writes
- Other: Total number of other requests
There are also line charts for the above categories.
Automatic import of preconfigured alert rules
After summarizing user experience, 14 commonly used alert rules are sorted out. These alert rules can monitor key indicators of the TDengine cluster and report alerts, such as abnormal and exceeded indicators.
Starting from TDengine-Server 3.3.4.3 (TDengine-datasource 3.6.3), TDengine Datasource supports automatic import of preconfigured alert rules. You can import 14 alert rules to Grafana (version 11 or later) with one click.
In the TDengine-datasource setting interface, turn on the "Load Tengine Alert" switch, click the "Save & test" button, the plugin will automatically load the mentioned 14 alert rules. The rules will be placed in the Grafana alerts directory. If not required, turn off the "Load TDengine Alert" switch, and click the button next to "Clear TDengine Alert" to clear all the alert rules imported into this data source.
After importing, click on "Alert rules" on the left side of the Grafana interface to view all current alert rules. By configuring contact points, users can receive alert notifications.
The specific configuration of the 14 alert rules is as follows:
| alert rule | Rule threshold | Behavior when no data | Data scanning interval | Duration | SQL |
|---|---|---|---|---|---|
| CPU load of dnode node | average > 80% | Trigger alert | 5 minutes | 5 minutes | select now(), dnode_ep, last(cpu_system) as cpu_use from log.taosd_dnodes_info where _ts >= (now- 5m) and _ts < now partition by dnode_ep |
| Memory of dnode node | average > 60% | Trigger alert | 5 minutes | 5 minutes | select now(), dnode_ep, last(mem_engine) / last(mem_total) * 100 as taosd from log.taosd_dnodes_info where _ts >= (now- 5m) and _ts <now partition by dnode_ep |
| Disk capacity occupancy of dnode nodes | > 80% | Trigger alert | 5 minutes | 5 minutes | select now(), dnode_ep, data_dir_level, data_dir_name, last(used) / last(total) * 100 as used from log.taosd_dnodes_data_dirs where _ts >= (now - 5m) and _ts < now partition by dnode_ep, data_dir_level, data_dir_name |
| Authorization expires | < 60 days | Trigger alert | 1 day | 0 0 seconds | select now(), cluster_id, last(grants_expire_time) / 86400 as expire_time from log.taosd_cluster_info where _ts >= (now - 24h) and _ts < now partition by cluster_id having first(_ts) > 0 |
| The used measurement points has reached the authorized number | >= 90% | Trigger alert | 1 day | 0 seconds | select now(), cluster_id, CASE WHEN max(grants_timeseries_total) > 0.0 THEN max(grants_timeseries_used) /max(grants_timeseries_total) * 100.0 ELSE 0.0 END AS result from log.taosd_cluster_info where _ts >= (now - 30s) and _ts < now partition by cluster_id having timetruncate(first(_ts), 1m) > 0 |
| Number of concurrent query requests | > 100 | Do not trigger alert | 1 minute | 0 seconds | select now() as ts, count(*) as slow_count from performance_schema.perf_queries |
| Maximum time for slow query execution (no time window) | > 300 seconds | Do not trigger alert | 1 minute | 0 seconds | select now() as ts, count(*) as slow_count from performance_schema.perf_queries where exec_usec>300000000 |
| dnode offline | total != alive | Trigger alert | 30 seconds | 0 seconds | select now(), cluster_id, last(dnodes_total) - last(dnodes_alive) as dnode_offline from log.taosd_cluster_info where _ts >= (now -30s) and _ts < now partition by cluster_id having first(_ts) > 0 |
| vnode offline | total != alive | Trigger alert | 30 seconds | 0 seconds | select now(), cluster_id, last(vnodes_total) - last(vnodes_alive) as vnode_offline from log.taosd_cluster_info where _ts >= (now - 30s) and _ts < now partition by cluster_id having first(_ts) > 0 |
| Number of data deletion requests | > 0 | Do not trigger alert | 30 seconds | 0 seconds | select now(), sum(count) asdelete_countfrom log.taos_sql_req where sql_type = 'delete' and _ts >= (now -30s) and _ts < now |
| Adapter RESTful request fail | > 5 | Do not trigger alert | 30 seconds | 0 seconds | select now(), sum(fail) asFailedfrom log.adapter_requests where req_type=0 and ts >= (now -30s) and ts < now |
| Adapter WebSocket request fail | > 5 | Do not trigger alert | 30 seconds | 0 seconds | select now(), sum(fail) asFailedfrom log.adapter_requests where req_type=1 and ts >= (now -30s) and ts < now |
| Dnode data reporting is missing | < 3 | Trigger alert | 180 seconds | 0 seconds | select now(), cluster_id, count(*) as dnode_report from log.taosd_cluster_info where _ts >= (now -180s) and _ts < now partition by cluster_id having timetruncate(first(_ts), 1h) > 0 |
| Restart dnode | max(update_time) > last(update_time) | Trigger alert | 90 seconds | 0 seconds | select now(), dnode_ep, max(uptime) - last(uptime) as dnode_report from log.taosd_dnodes_info where _ts >= (now - 90s) and _ts < now partition by dnode_ep |
TDengine users can modify and improve these alert rules according to their own business needs. In Grafana 7.5 and below versions, the Dashboard and Alert rules functions are combined, while in subsequent new versions, the two functions are separated. To be compatible with Grafana7.5 and below versions, an Alert Used Only panel has been added to the TDinsight panel, which is only required for Grafana7.5 and below versions.
Upgrade
The following three methods can be used for upgrading:
- Use the graphical interface, if there is a new version, you can click update on the "TDengine Datasource" plugin page to upgrade.
- Follow the manual installation steps to install the new Grafana plugin and Dashboard yourself.
- Upgrade to the latest Grafana plugin and TDinsight Dashboard by rerunning the
TDinsight.shscript.
Uninstallation
For different installation methods, when uninstalling:
- Use the graphical interface, click "Uninstall" on the "TDengine Datasource" plugin page.
- For TDinsight installed via the
TDinsight.shscript, you can use the command lineTDinsight.sh -Rto clean up related resources. - For manually installed TDinsight, to completely uninstall, you need to clean up the following:
- TDinsight Dashboard in Grafana.
- Data Source in Grafana.
- Delete the
tdengine-datasourceplugin from the plugin installation directory.
Appendix
Detailed Description of TDinsight.sh
Below is a detailed explanation of the usage of TDinsight.sh:
Usage:
   ./TDinsight.sh
   ./TDinsight.sh -h|--help
   ./TDinsight.sh -n <ds-name> -a <api-url> -u <user> -p <password>

Install and configure TDinsight dashboard in Grafana on Ubuntu 18.04/20.04 system.

-h, -help,          --help                  Display help

-V, -verbose,       --verbose               Run script in verbose mode. Will print out each step of execution.

-v, --plugin-version <version>              TDengine datasource plugin version, [default: latest]

-P, --grafana-provisioning-dir <dir>        Grafana provisioning directory, [default: /etc/grafana/provisioning/]
-G, --grafana-plugins-dir <dir>             Grafana plugins directory, [default: /var/lib/grafana/plugins]
-O, --grafana-org-id <number>               Grafana organization id. [default: 1]

-n, --tdengine-ds-name <string>             TDengine datasource name, no space. [default: TDengine]
-a, --tdengine-api <url>                    TDengine REST API endpoint. [default: http://127.0.0.1:6041]
-u, --tdengine-user <string>                TDengine user name. [default: root]
-p, --tdengine-password <string>            TDengine password. [default: taosdata]

-i, --tdinsight-uid <string>                Replace with a non-space ASCII code as the dashboard id. [default: tdinsight]
-t, --tdinsight-title <string>              Dashboard title. [default: TDinsight]
-e, --tdinsight-editable                    If the provisioning dashboard could be editable. [default: false]
Most command line options can also be achieved through environment variables.
| Short Option | Long Option | Environment Variable | Description |
|---|---|---|---|
| -v | --plugin-version | TDENGINE_PLUGIN_VERSION | TDengine datasource plugin version, default is latest. |
| -P | --grafana-provisioning-dir | GF_PROVISIONING_DIR | Grafana provisioning directory, default is /etc/grafana/provisioning/ |
| -G | --grafana-plugins-dir | GF_PLUGINS_DIR | Grafana plugins directory, default is /var/lib/grafana/plugins. |
| -O | --grafana-org-id | GF_ORG_ID | Grafana organization ID, default is 1. |
| -n | --tdengine-ds-name | TDENGINE_DS_NAME | TDengine datasource name, default is TDengine. |
| -a | --tdengine-api | TDENGINE_API | TDengine REST API endpoint. Default is http://127.0.0.1:6041. |
| -u | --tdengine-user | TDENGINE_USER | TDengine user name. [default: root] |
| -p | --tdengine-password | TDENGINE_PASSWORD | TDengine password. [default: taosdata] |
| -i | --tdinsight-uid | TDINSIGHT_DASHBOARD_UID | TDinsight dashboard uid. [default: tdinsight] |
| -t | --tdinsight-title | TDINSIGHT_DASHBOARD_TITLE | TDinsight dashboard title. [default: TDinsight] |
| -e | --tdinsight-editable | TDINSIGHT_DASHBOARD_EDITABLE | If the provisioning dashboard could be editable. [default: false] |
The new version of the plugin uses the Grafana unified alerting feature, the -E option is no longer supported.
Assuming you start the TDengine database on the host tdengine with HTTP API port 6041, user root1, and password pass5ord. Execute the script:
./TDinsight.sh -a http://tdengine:6041 -u root1 -p pass5ord
If you want to monitor multiple TDengine clusters, you need to set up multiple TDinsight dashboards. Setting up a non-default TDinsight requires some changes: the -n -i -t options need to be changed to non-default names, and if using the built-in SMS alert feature, -N and -L should also be changed.
sudo ./TDengine.sh -n TDengine-Env1 -a http://another:6041 -u root -p taosdata -i tdinsight-env1 -t 'TDinsight Env1'
Please note that configuring the data source, notification channel, and dashboard in the frontend is not changeable. You should update the configuration again through this script or manually change the configuration files in the /etc/grafana/provisioning directory (this is the default directory for Grafana, change as needed using the -P option).
Especially, when using Grafana Cloud or other organizations, -O can be used to set the organization ID. -G can specify the Grafana plugin installation directory. -e parameter sets the dashboard to be editable.