TDinsight - A Zero-dependency Monitoring Solution For TDengine with Grafana
TDinsight uses TDengine's built-in database(log) and Grafana to monitor TDengine itself.
After TDengine starts, it will automatically create a database named log, and regularly record the server's CPU, memory, disk usage, network bandwidth, number of requests, disk reading/writing throughput, slow queries, and other information for monitoring purposes. It also records important system operations(such as logging in, creating or deleting databases, etc.) and errors. TDinsight will visualize the TDengine cluster status, nodes information, insertion and query requests, resource usage, etc., with Grafana and TDengine data source plugin for Grafana. It also supports abnormal status alarms of nodes including vnode, dnode, and mnode, which provides convenience for the operators to monitor the running status of TDengine clusters in real-time. In this document, we'll guide users to install the Grafana server, and then install the TDengine data source plugin and deploy the TDinsight visualization dashboard through the TDinsight.sh script automatically or manually.
Requirements
At least, you must have a single-node TDengine server or a TDengine cluster with multiple nodes, and a server host for Grafana. This dashboard requires new log database(since v2.3.3.0), including cluster_info dnodes_info vgroups_info tables and so on.
Install Grafana
The feature-rich Grafana dashboard for TDengine (cluster or not) requires Grafana 7.x or 8.x, so we recommend to use the latest Grafana 7/8 version here. You can install Grafana in any supported OS, follow the installation instructions.
Install Grafana on Debian or Ubuntu
For Debian or Ubuntu OS, the first option is to use grafana APT repository. Here is how-to install it from scratch:
sudo apt-get install -y apt-transport-https
sudo apt-get install -y software-properties-common wget
wget -q -O - https://packages.grafana.com/gpg.key |\
  sudo apt-key add -
echo "deb https://packages.grafana.com/oss/deb stable main" |\
  sudo tee -a /etc/apt/sources.list.d/grafana.list
sudo apt-get update
sudo apt-get install grafana
Install Grafana on CentOS/RHEL
You can install it from the official YUM repository.
sudo tee /etc/yum.repos.d/grafana.repo << EOF
[grafana]
name=grafana
baseurl=https://packages.grafana.com/oss/rpm
repo_gpgcheck=1
enabled=1
gpgcheck=1
gpgkey=https://packages.grafana.com/gpg.key
sslverify=1
sslcacert=/etc/pki/tls/certs/ca-bundle.crt
EOF
sudo yum install grafana
Or install with RPM:
wget https://dl.grafana.com/oss/release/grafana-7.5.11-1.x86_64.rpm
sudo yum install grafana-7.5.11-1.x86_64.rpm
# it's ok to use in one line
sudo yum install \
  https://dl.grafana.com/oss/release/grafana-7.5.11-1.x86_64.rpm
Setup TDinsight Automatically
We've created a TDinsight.sh script for automation with Grafana provisioning strategy.
You can download the script by wget or other tools:
wget https://github.com/taosdata/grafanaplugin/releases/latest/download/TDinsight.sh
chmod +x TDinsight.sh
This script will automatically download the latest TDengine data source plugin and TDinsight dashboard, covert them to provisioning configurations and setup TDinsight dashboard. With some more alert options, you will get the alert notification feature within an one-line command.
For the most simple use case, suppose you're serving TDengine and Grafana on the same host with both default options. Running ./TDinsight.sh and opening Grafana url are the only things you need to setup TDinsight.
Here is the usage of TDinsight.sh:
Usage:
   ./TDinsight.sh
   ./TDinsight.sh -h|--help
   ./TDinsight.sh -n <ds-name> -a <api-url> -u <user> -p <password>

Install and configure TDinsight dashboard in Grafana on Ubuntu 18.04/20.04 system.

-h, -help,          --help                  Display help

-V, -verbose,       --verbose               Run script in verbose mode. Will print out each step of execution.

-v, --plugin-version <version>              TDengine datasource plugin version, [default: latest]

-P, --grafana-provisioning-dir <dir>        Grafana provisioning directory, [default: /etc/grafana/provisioning/]
-G, --grafana-plugins-dir <dir>             Grafana plugins directory, [default: /var/lib/grafana/plugins]
-O, --grafana-org-id <number>               Grafana organization id. [default: 1]

-n, --tdengine-ds-name <string>             TDengine datasource name, no space. [default: TDengine]
-a, --tdengine-api <url>                    TDengine REST API endpoint. [default: http://127.0.0.1:6041]
-u, --tdengine-user <string>                TDengine user name. [default: root]
-p, --tdengine-password <string>            TDengine password. [default: taosdata]

-i, --tdinsight-uid <string>                Replace with a non-space ASCII code as the dashboard id. [default: tdinsight]
-t, --tdinsight-title <string>              Dashboard title. [default: TDinsight]
-e, --tdinsight-editable                    If the provisioning dashboard could be editable. [default: false]

-E, --external-notifier <string>            Apply external notifier uid to TDinsight dashboard.

Aliyun SMS as Notifier:
-s, --sms-enabled                           To enable tdengine-datasource plugin builtin aliyun sms webhook.
-N, --sms-notifier-name <string>            Provisioning notifier name.[default: TDinsight Builtin SMS]
-U, --sms-notifier-uid <string>             Provisioning notifier uid, use lowercase notifier name by default.
-D, --sms-notifier-is-default               Set notifier as default.
-I, --sms-access-key-id <string>            Aliyun sms access key id
-K, --sms-access-key-secret <string>        Aliyun sms access key secret
-S, --sms-sign-name <string>                Sign name
-C, --sms-template-code <string>            Template code
-T, --sms-template-param <string>           Template param, a escaped json string like '{"alarm_level":"%s","time":"%s","name":"%s","content":"%s"}'
-B, --sms-phone-numbers <string>            Comma-separated numbers list, eg "189xxxxxxxx,132xxxxxxxx"
-L, --sms-listen-addr <string>              [default: 127.0.0.1:9100]
Most of the CLI options are environment variable recognizable.
| short | long | env | description |
|---|---|---|---|
| -v | --plugin-version | TDENGINE_PLUGIN_VERSION | TDengine datasource plugin version, default is latest. |
| -P | --grafana-provisioning-dir | GF_PROVISIONING_DIR | Grafana provisioning directory, [default: /etc/grafana/provisioning/] |
| -G | --grafana-plugins-dir | GF_PLUGINS_DIR | Grafana plugins directory, default is /var/lib/grafana/plugins. |
| -O | --grafana-org-id | GF_ORG_ID | Grafana organization id, default is 1. |
| -n | --tdengine-ds-name | TDENGINE_DS_NAME | TDengine datasource name, default is TDengine. |
| -a | --tdengine-api | TDENGINE_API | TDengine REST API endpoint. default is http://127.0.0.1:6041. |
| -u | --tdengine-user | TDENGINE_USER | TDengine user name. [default: root] |
| -p | --tdengine-password | TDENGINE_PASSWORD | TDengine password. [default: taosdata] |
| -i | --tdinsight-uid | TDINSIGHT_DASHBOARD_UID | TDinsight dashboard uid. [default: tdinsight] |
| -t | --tdinsight-title | TDINSIGHT_DASHBOARD_TITLE | TDinsight dashboard title. [default: TDinsight] |
| -e | --tdinsight-editable | TDINSIGHT_DASHBOARD_EDITABLE | If the provisioning dashboard could be editable. [default: false] |
| -E | --external-notifier | EXTERNAL_NOTIFIER | Apply external notifier uid to TDinsight dashboard. |
| -s | --sms-enabled | SMS_ENABLED | To enable tdengine-datasource plugin builtin aliyun sms webhook. |
| -N | --sms-notifier-name | SMS_NOTIFIER_NAME | Provisioning notifier name.[default: TDinsight Builtin SMS] |
| -U | --sms-notifier-uid | SMS_NOTIFIER_UID | Provisioning notifier uid, use lowercase notifier name by default. |
| -D | --sms-notifier-is-default | SMS_NOTIFIER_IS_DEFAULT | Set notifier as default. |
| -I | --sms-access-key-id | SMS_ACCESS_KEY_ID | Aliyun sms access key id |
| -K | --sms-access-key-secret | SMS_ACCESS_KEY_SECRET | Aliyun sms access key secret |
| -S | --sms-sign-name | SMS_SIGN_NAME | Sign name |
| -C | --sms-template-code | SMS_TEMPLATE_CODE | Template code |
| -T | --sms-template-param | SMS_TEMPLATE_PARAM | Template params json format |
| -B | --sms-phone-numbers | SMS_PHONE_NUMBERS | Comma-separated numbers list, eg "189xxxxxxxx,132xxxxxxxx" |
| -L | --sms-listen-addr | SMS_LISTEN_ADDR | The builtin sms webhook listening address, default is 127.0.0.1:9100 |
Suppose you are serving TDengine on host tdengine, with HTTP API port 6041, user root1, password pass5ord. Use the script as:
sudo ./TDinsight.sh -a http://tdengine:6041 -u root1 -p pass5ord
We are providing a -E options to configure existing notification channel for TDinsight from command line. Suppose your Grafana user and password is admin:admin, use the following command to get the notification channels:
curl --no-progress-meter -u admin:admin http://localhost:3000/api/alert-notifications | jq
Here, we use uid property of the notification channel as -E input.
sudo ./TDinsight.sh -a http://tdengine:6041 -u root1 -p pass5ord -E existing-notifier
If you want to use Aliyun SMS service as notification channel, you should enable it with -s flag and the settings:
-N: Notification channel name, default isTDinsight Builtin SMS.-U: Notification channel uid, default is lowercase of thenamewith any other characters replaced with -, for default-N, it istdinsight-builtin-sms.-I: Aliyun SMS access key id.-K: Aliyun SMS access key secret.-S: Aliyun SMS sign name.-C: Aliyun SMS template id.-T: Aliyun SMS template params JSON format,'{"alarm_level":"%s","time":"%s","name":"%s","content":"%s"}'. It has four params: alerting level, alerting time, the name of alert rule, and the content text of the alert rule.-B: Target phone numbers list, separated by comma,.
If you want to monitor multiple TDengine clusters, you need to setup multiple TDinsight dashboards. There's some required changes to setup non-default TDinsight - -n -i -t options are need to be changed to some other names, if you are using SMS alerting feature, -N and -L should be changed too.
sudo ./TDengine.sh -n TDengine-Env1 -a http://another:6041 -u root -p taosdata -i tdinsight-env1 -t 'TDinsight Env1'
# if use builtin sms notifier.
sudo ./TDengine.sh -n TDengine-Env1 -a http://another:6041 -u root -p taosdata -i tdinsight-env1 -t 'TDinsight Env1' \
  -s -N 'Env1 SMS' -I xx -K xx -S xx -C SMS_XX -T '' -B 00000000000 -L 127.0.0.01:10611
Note that, the provisioning data sources, notification channels and dashboards are not changeable at frontend. You should update the configuration by this script again or change the provisioning configurations manually. The provisioning configurations are all located in /etc/grafana/provisioning directory (the directory is grafana default, change it with -P option as you need).
For special use cases, -O would set the organization id when you use Grafana Cloud or use a different organization. -G let you choose the grafana plugins install directory. -e would set the dashboard to be editable.
Setup TDinsight Manually
Install TDengine Data Source Plugin
Install the latest version of TDengine data-source plugin from GitHub.
get_latest_release() {
  curl --silent "https://api.github.com/repos/taosdata/grafanaplugin/releases/latest" |
    grep '"tag_name":' |
    sed -E 's/.*"v([^"]+)".*/\1/'
}
TDENGINE_PLUGIN_VERSION=$(get_latest_release)
sudo grafana-cli \
  --pluginUrl https://github.com/taosdata/grafanaplugin/releases/download/v$TDENGINE_PLUGIN_VERSION/tdengine-datasource-$TDENGINE_PLUGIN_VERSION.zip \
  plugins install tdengine-datasource
NOTE: If you're using an older version before v3.1.7, please configure to allow using unsigned plugins by add following lines to /etc/grafana/grafana.ini.
[plugins]
allow_loading_unsigned_plugins = tdengine-datasource
Start Grafana Service
systemctl enable grafana-server
systemctl start grafana-server
Login to Grafana
Open the default grafana url: http://localhost:3000 in your web browser.
The default username/password is both admin.
Grafana would ask you to change the password after first login.
Add TDengine Data Source
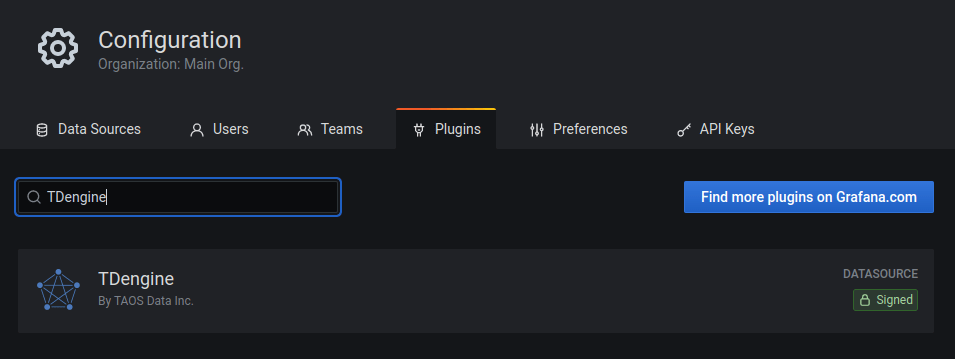
Point to Configurations -> Data Sources menu and then Add data source button.

Search and choose TDengine.
Configure TDengine data source.
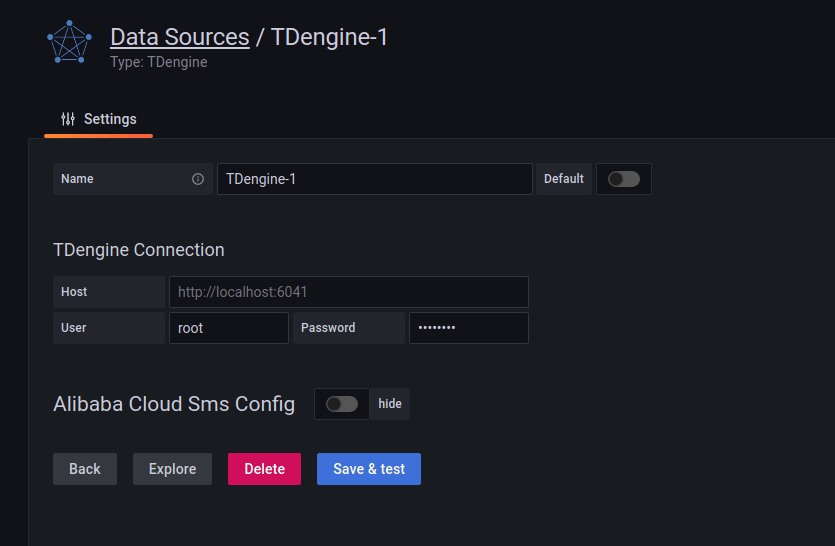
Save and test it, it should say 'TDengine Data source is working'.

Import TDengine Dashboard
Point to + / Create - import (or /dashboard/import url).
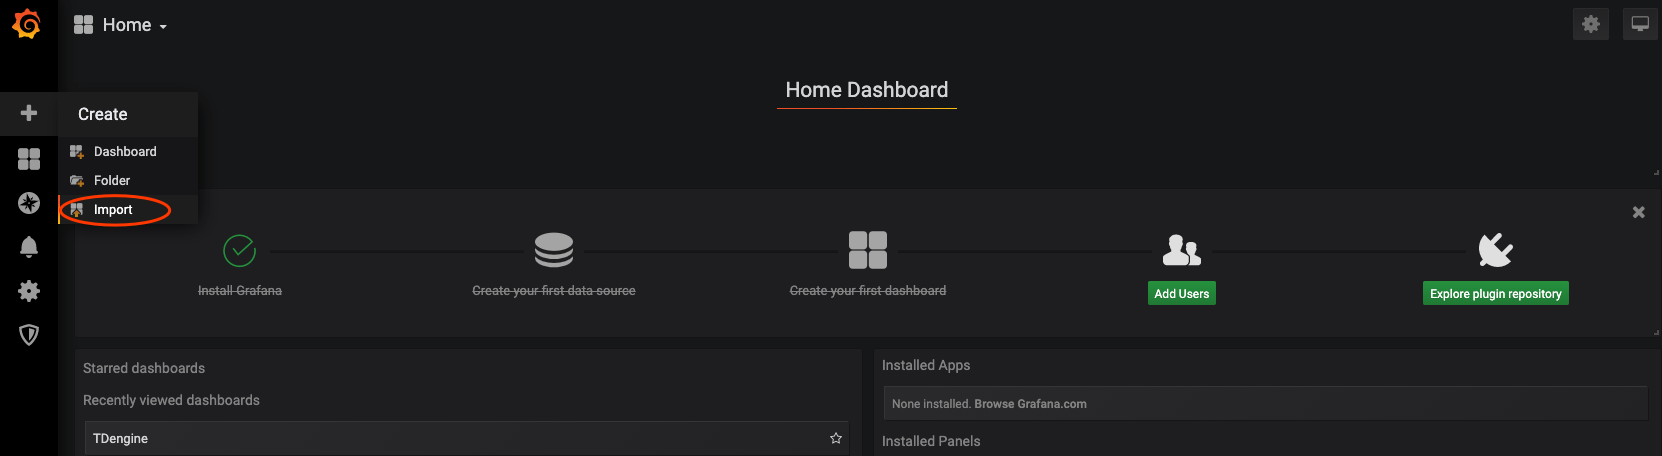
Use the dashboard id 15167 via grafana.com.

Then it's all done.
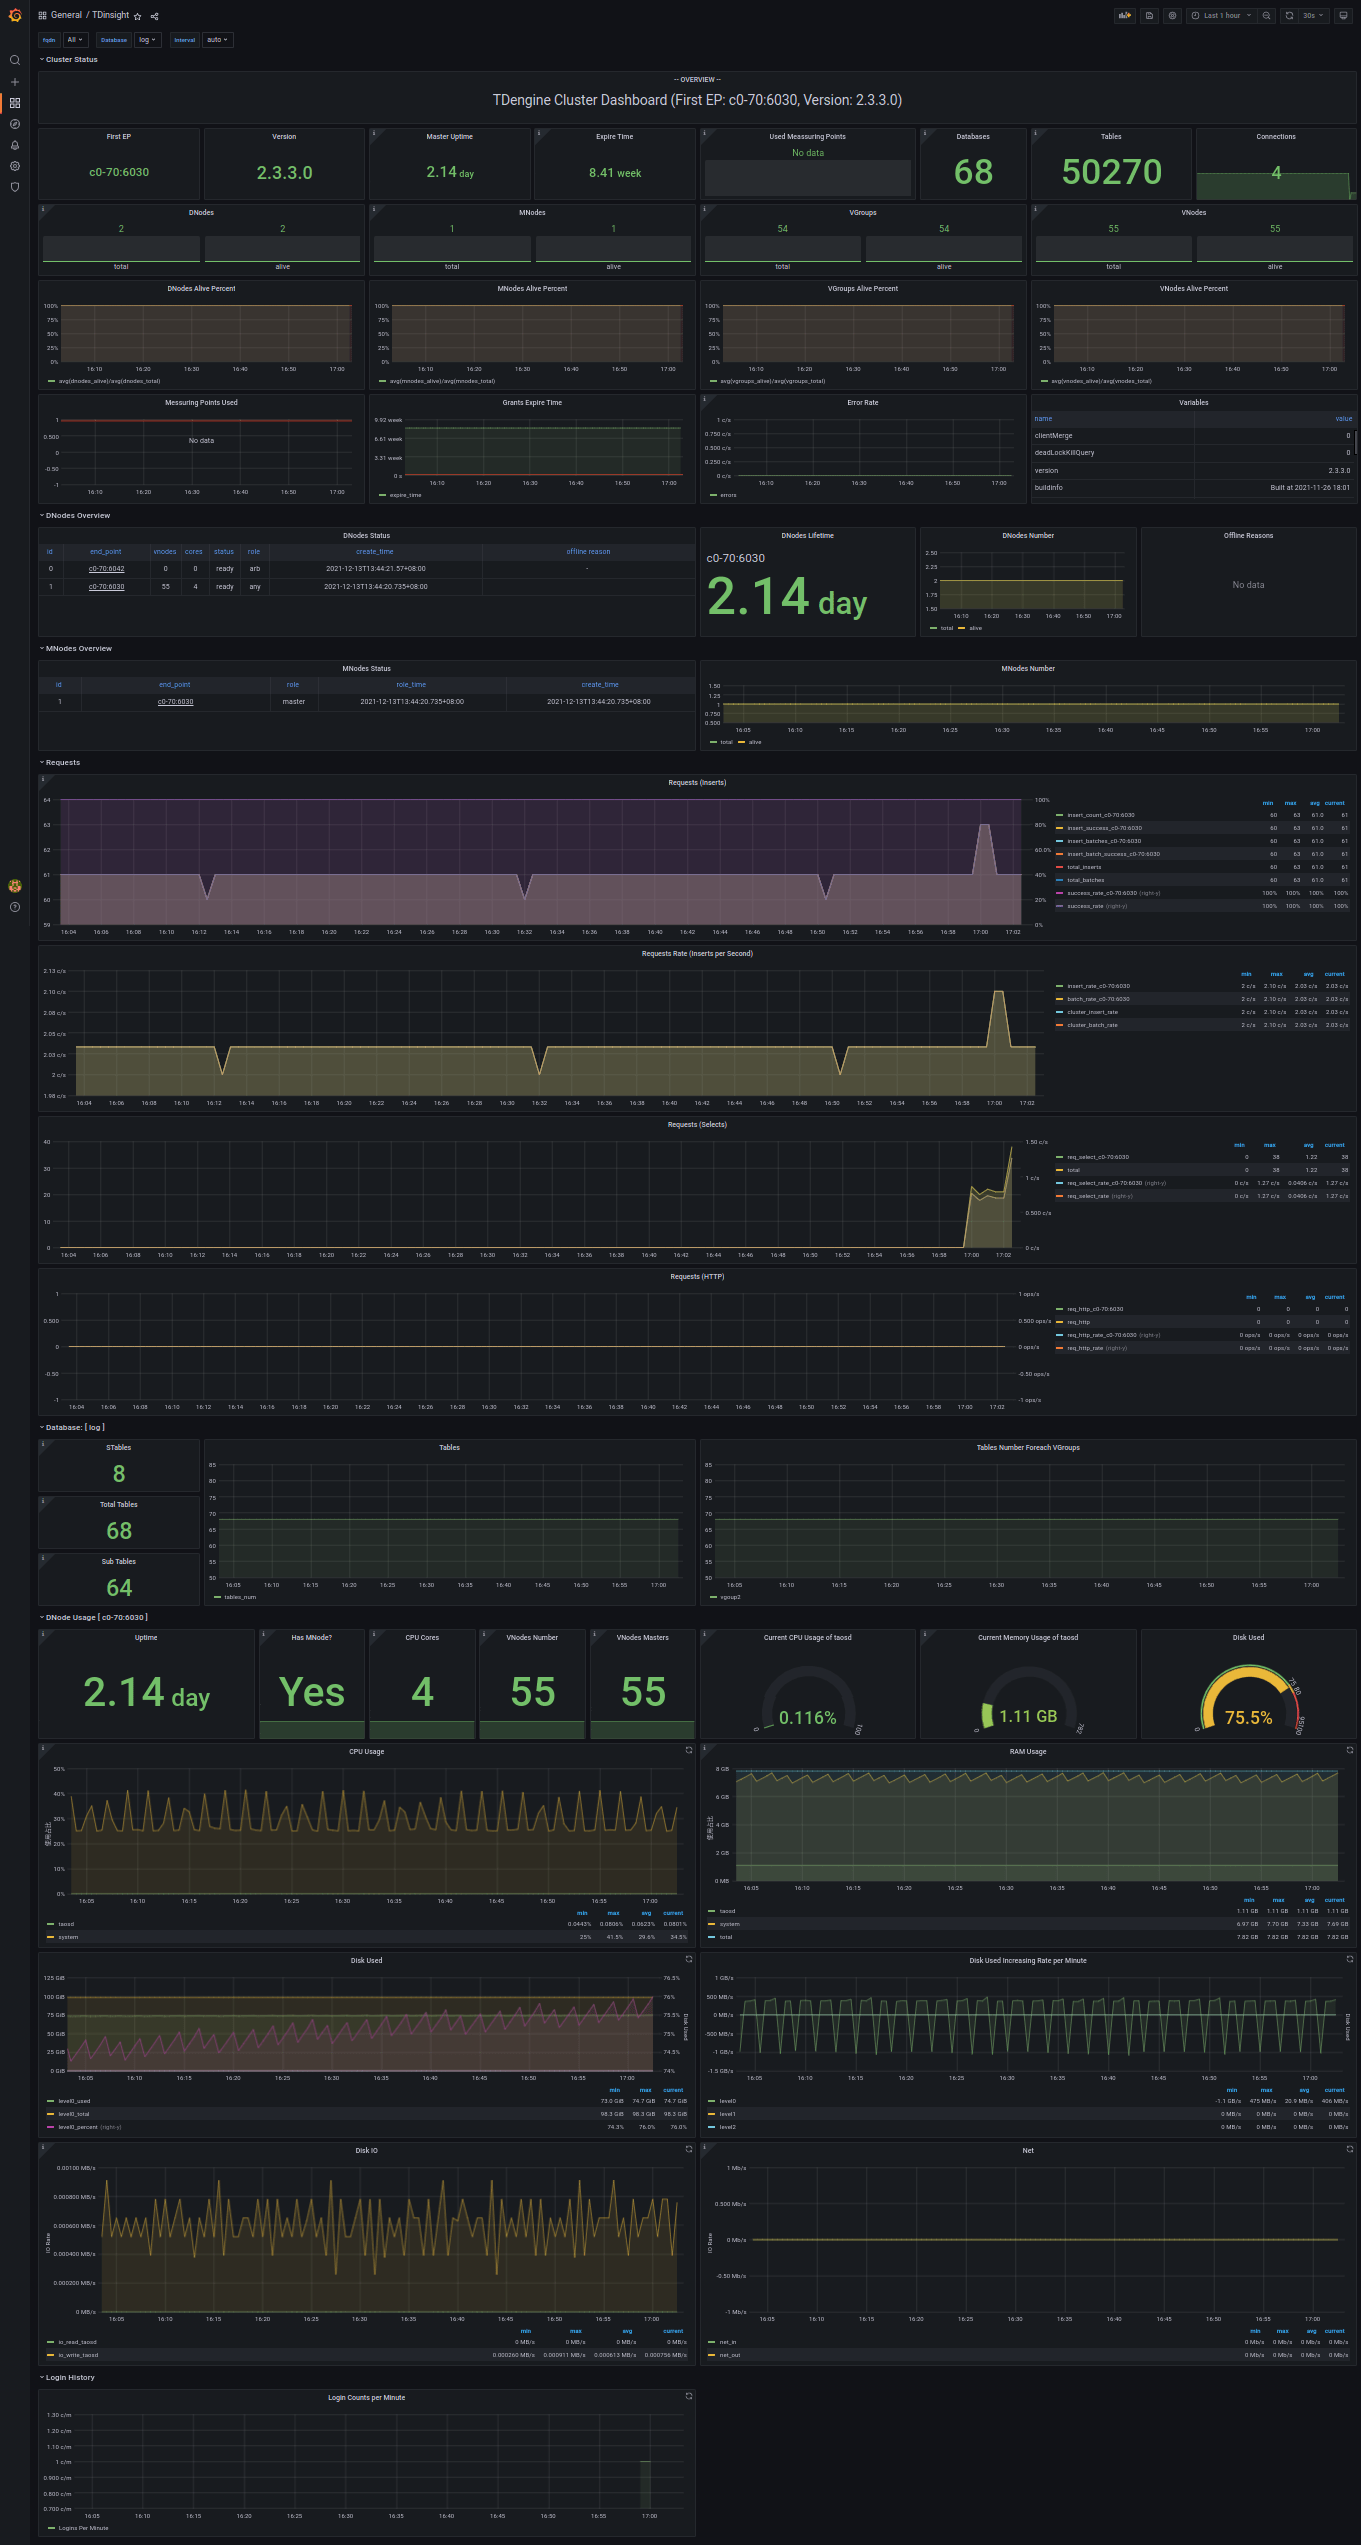
The full page view for TDengine will like below.
TDinsight Dashboard Details
The TDinsight dashboard aims to provide TDengine cluster resources usage and status of dnodes, mnodes, vnodes, or databases. There're several partitions of metrics.
Cluster Status
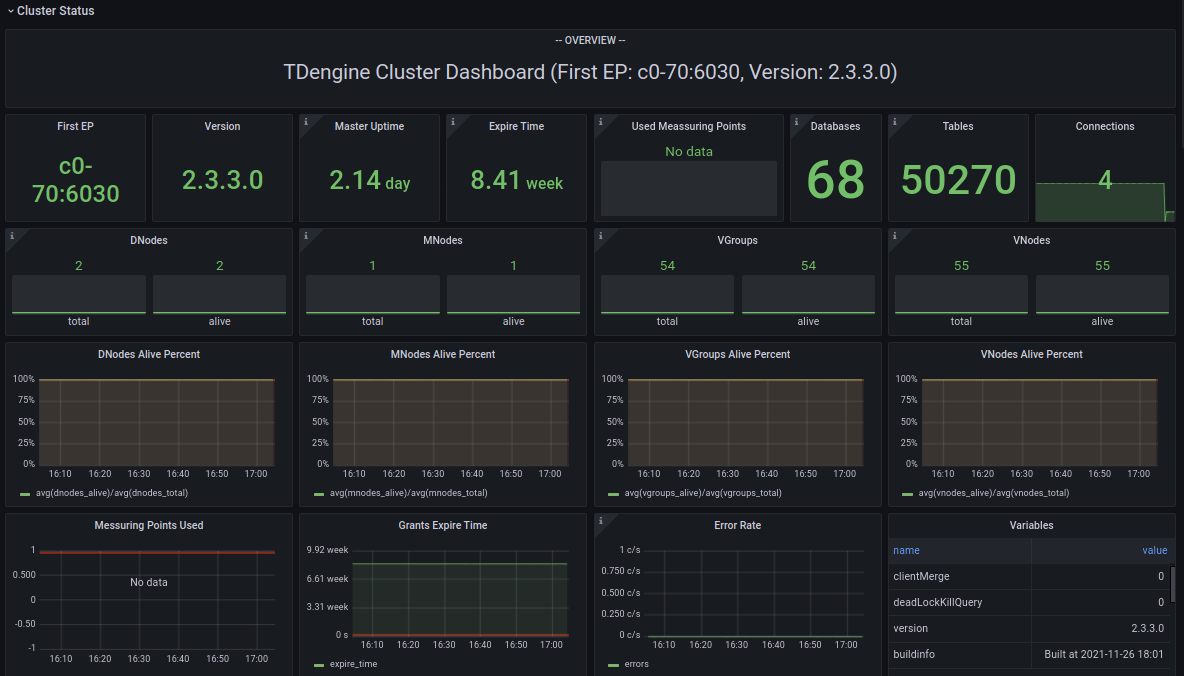
Include cluster current information and status (left-right, top-down).
- First EP: First EP in current TDengine cluster.
- Version: Server version of MNode.
- Master Uptime: Time that the current master mnode elected.
- Expire Time - Expire time for enterprise version.
- Used Measuring Points - Used measuring points for enterprise version.
- Databases - The total number of databases.
- Connections - The connections number in current time.
- DNodes/MNodes/VGroups/VNodes: Total and alive number for each kind of resources.
- DNodes/MNodes/VGroups/VNodes Alive Percent: alive number / total number for each kind of resources, with alert rule enabled, by default it will be triggered when the resource is not 100% alive.
- Measuring Points Used: Used measuring points for enterprise version with alert enabled.
- Grants Expire Time: Expire time for enterprise version with alert enabled.
- Error Rate: The total error rate for the cluster with alert enabled.
- Variables: generated by
show variablescommand and displayed as Table view.
DNodes Status
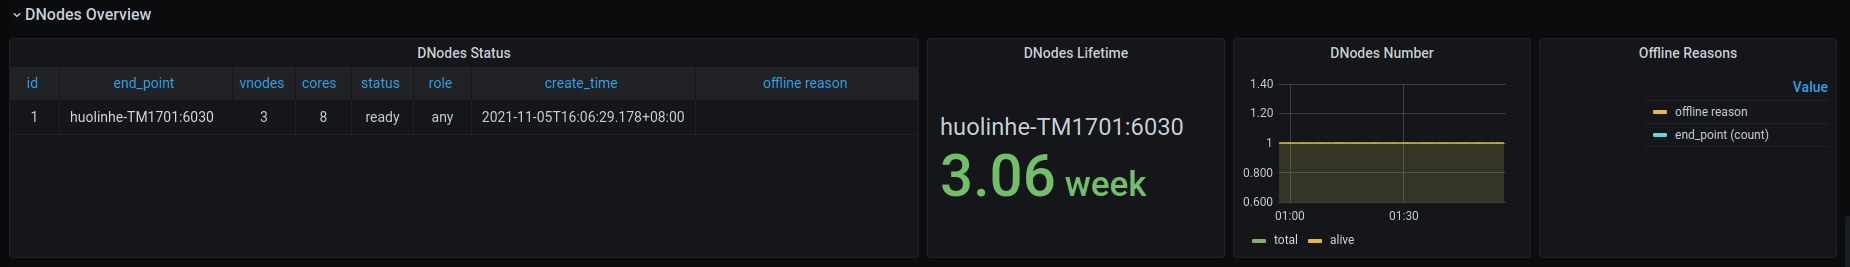
- DNodes Status: Simple table view for
show dnodes. - DNodes Lifetime: The time elapsed from dnode created.
- DNodes Number: DNodes number changes time-series graph.
- Offline Reasons: Offline reasons pie chart if any dnode status is offline.
MNodes Overview
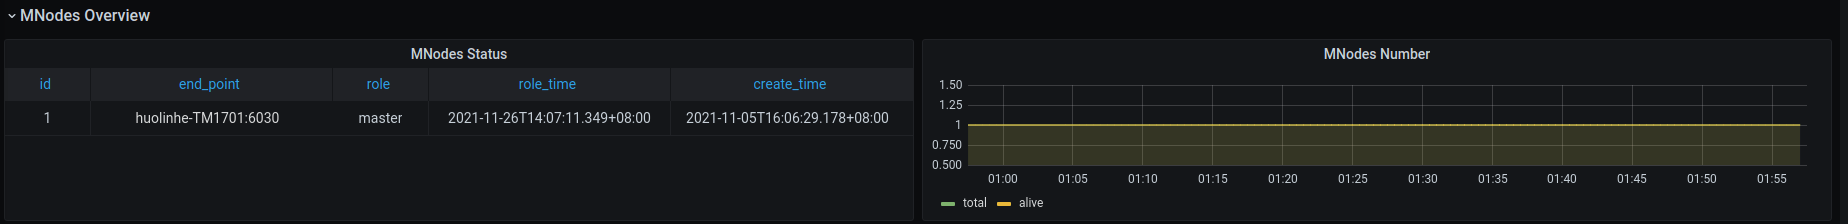
- MNodes Status: Simple table view for
show mnodes. - MNodes Number: like
DNodes Number, but for mnodes.
Requests
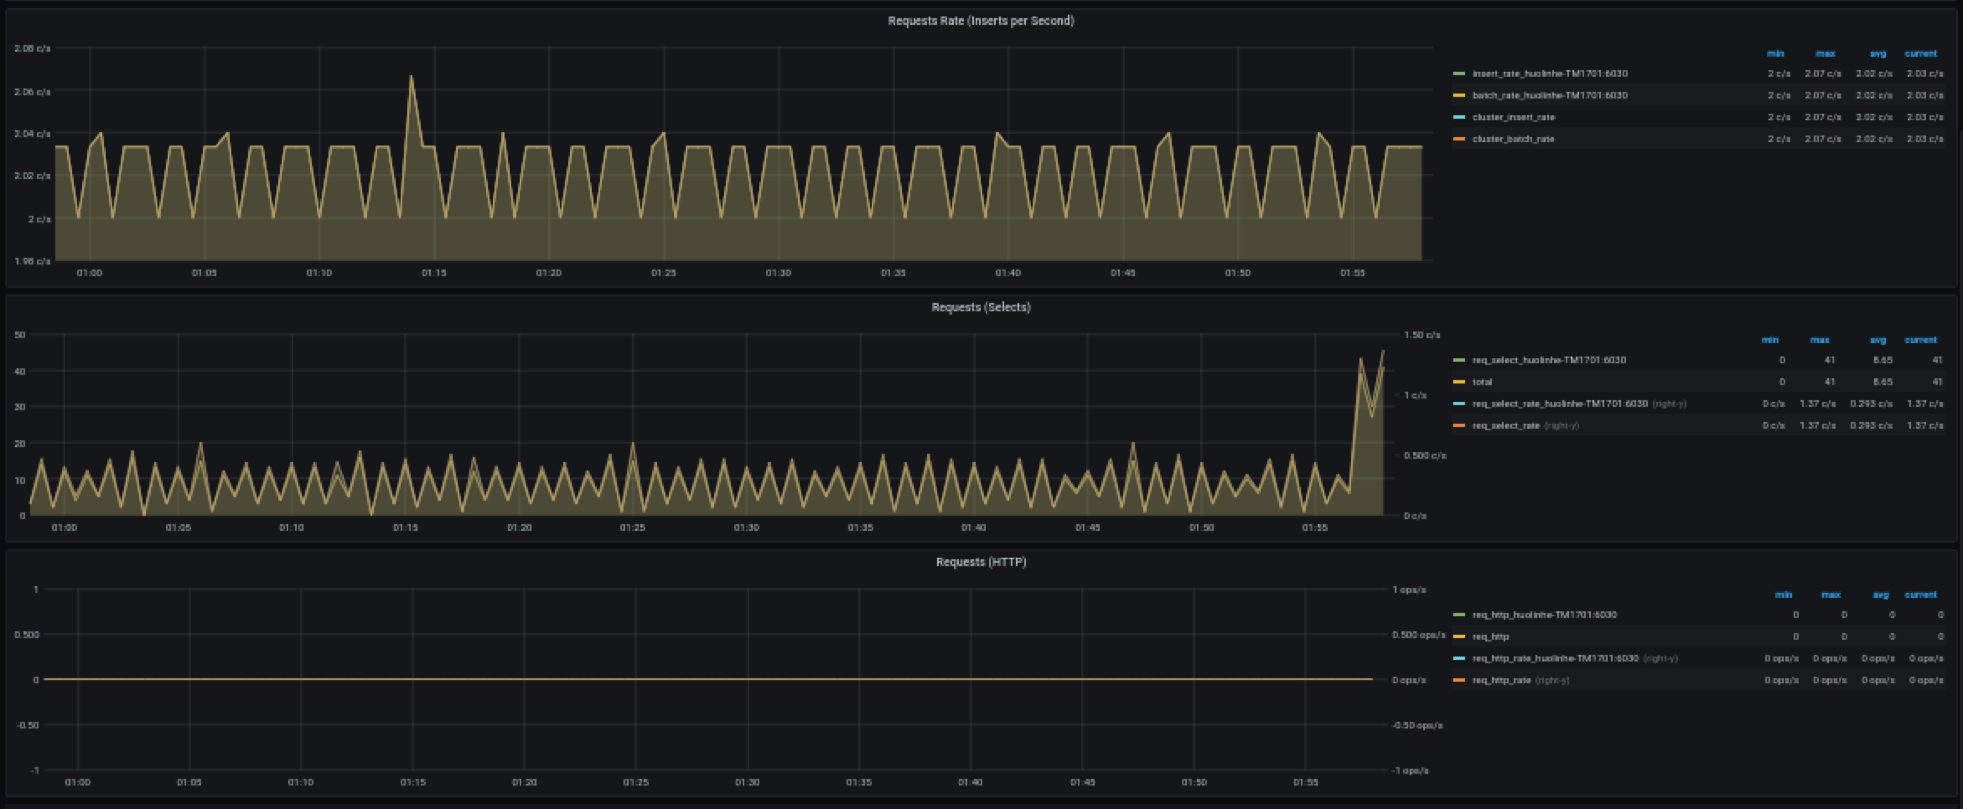
- Requests Rate(Inserts per Second): Insert count per second rate.
- Requests (Selects): Select requests count and rate.
- Requests (HTTP): HTTP requests count and rate.
Database for each $database
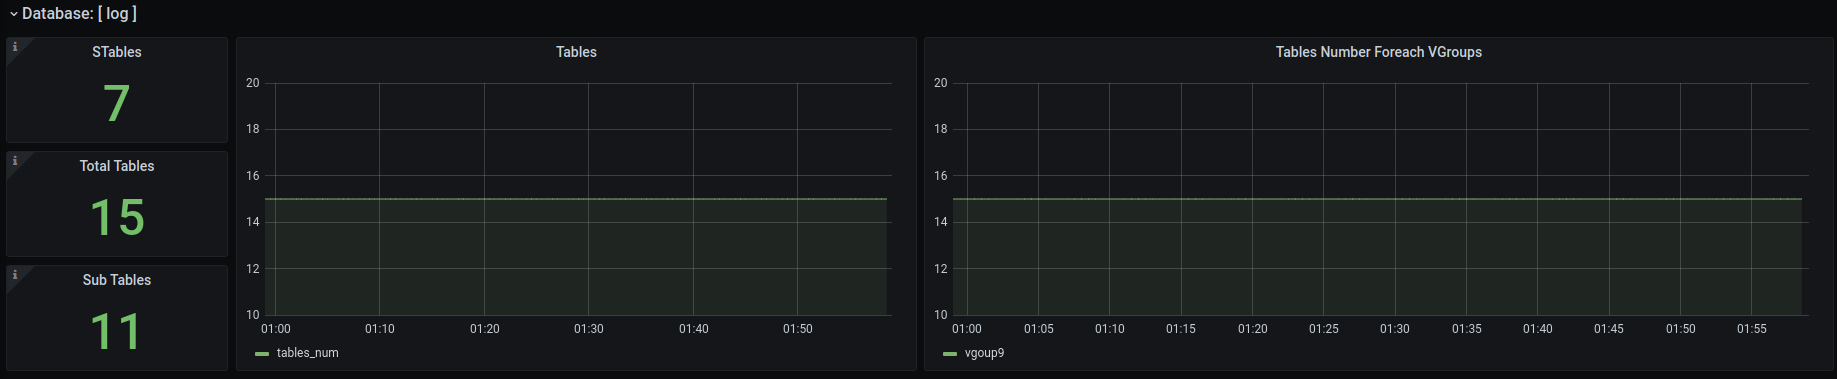
- STables: Number of stables.
- Total Tables: Number of all tables.
- Sub Tables: Number of tables that is sub table of a stable.
- Tables: Tables changes time-series data.
- Tables Number Foreach VGroups: Tables number for each vgroups.
DNode Usage for each $fqdn
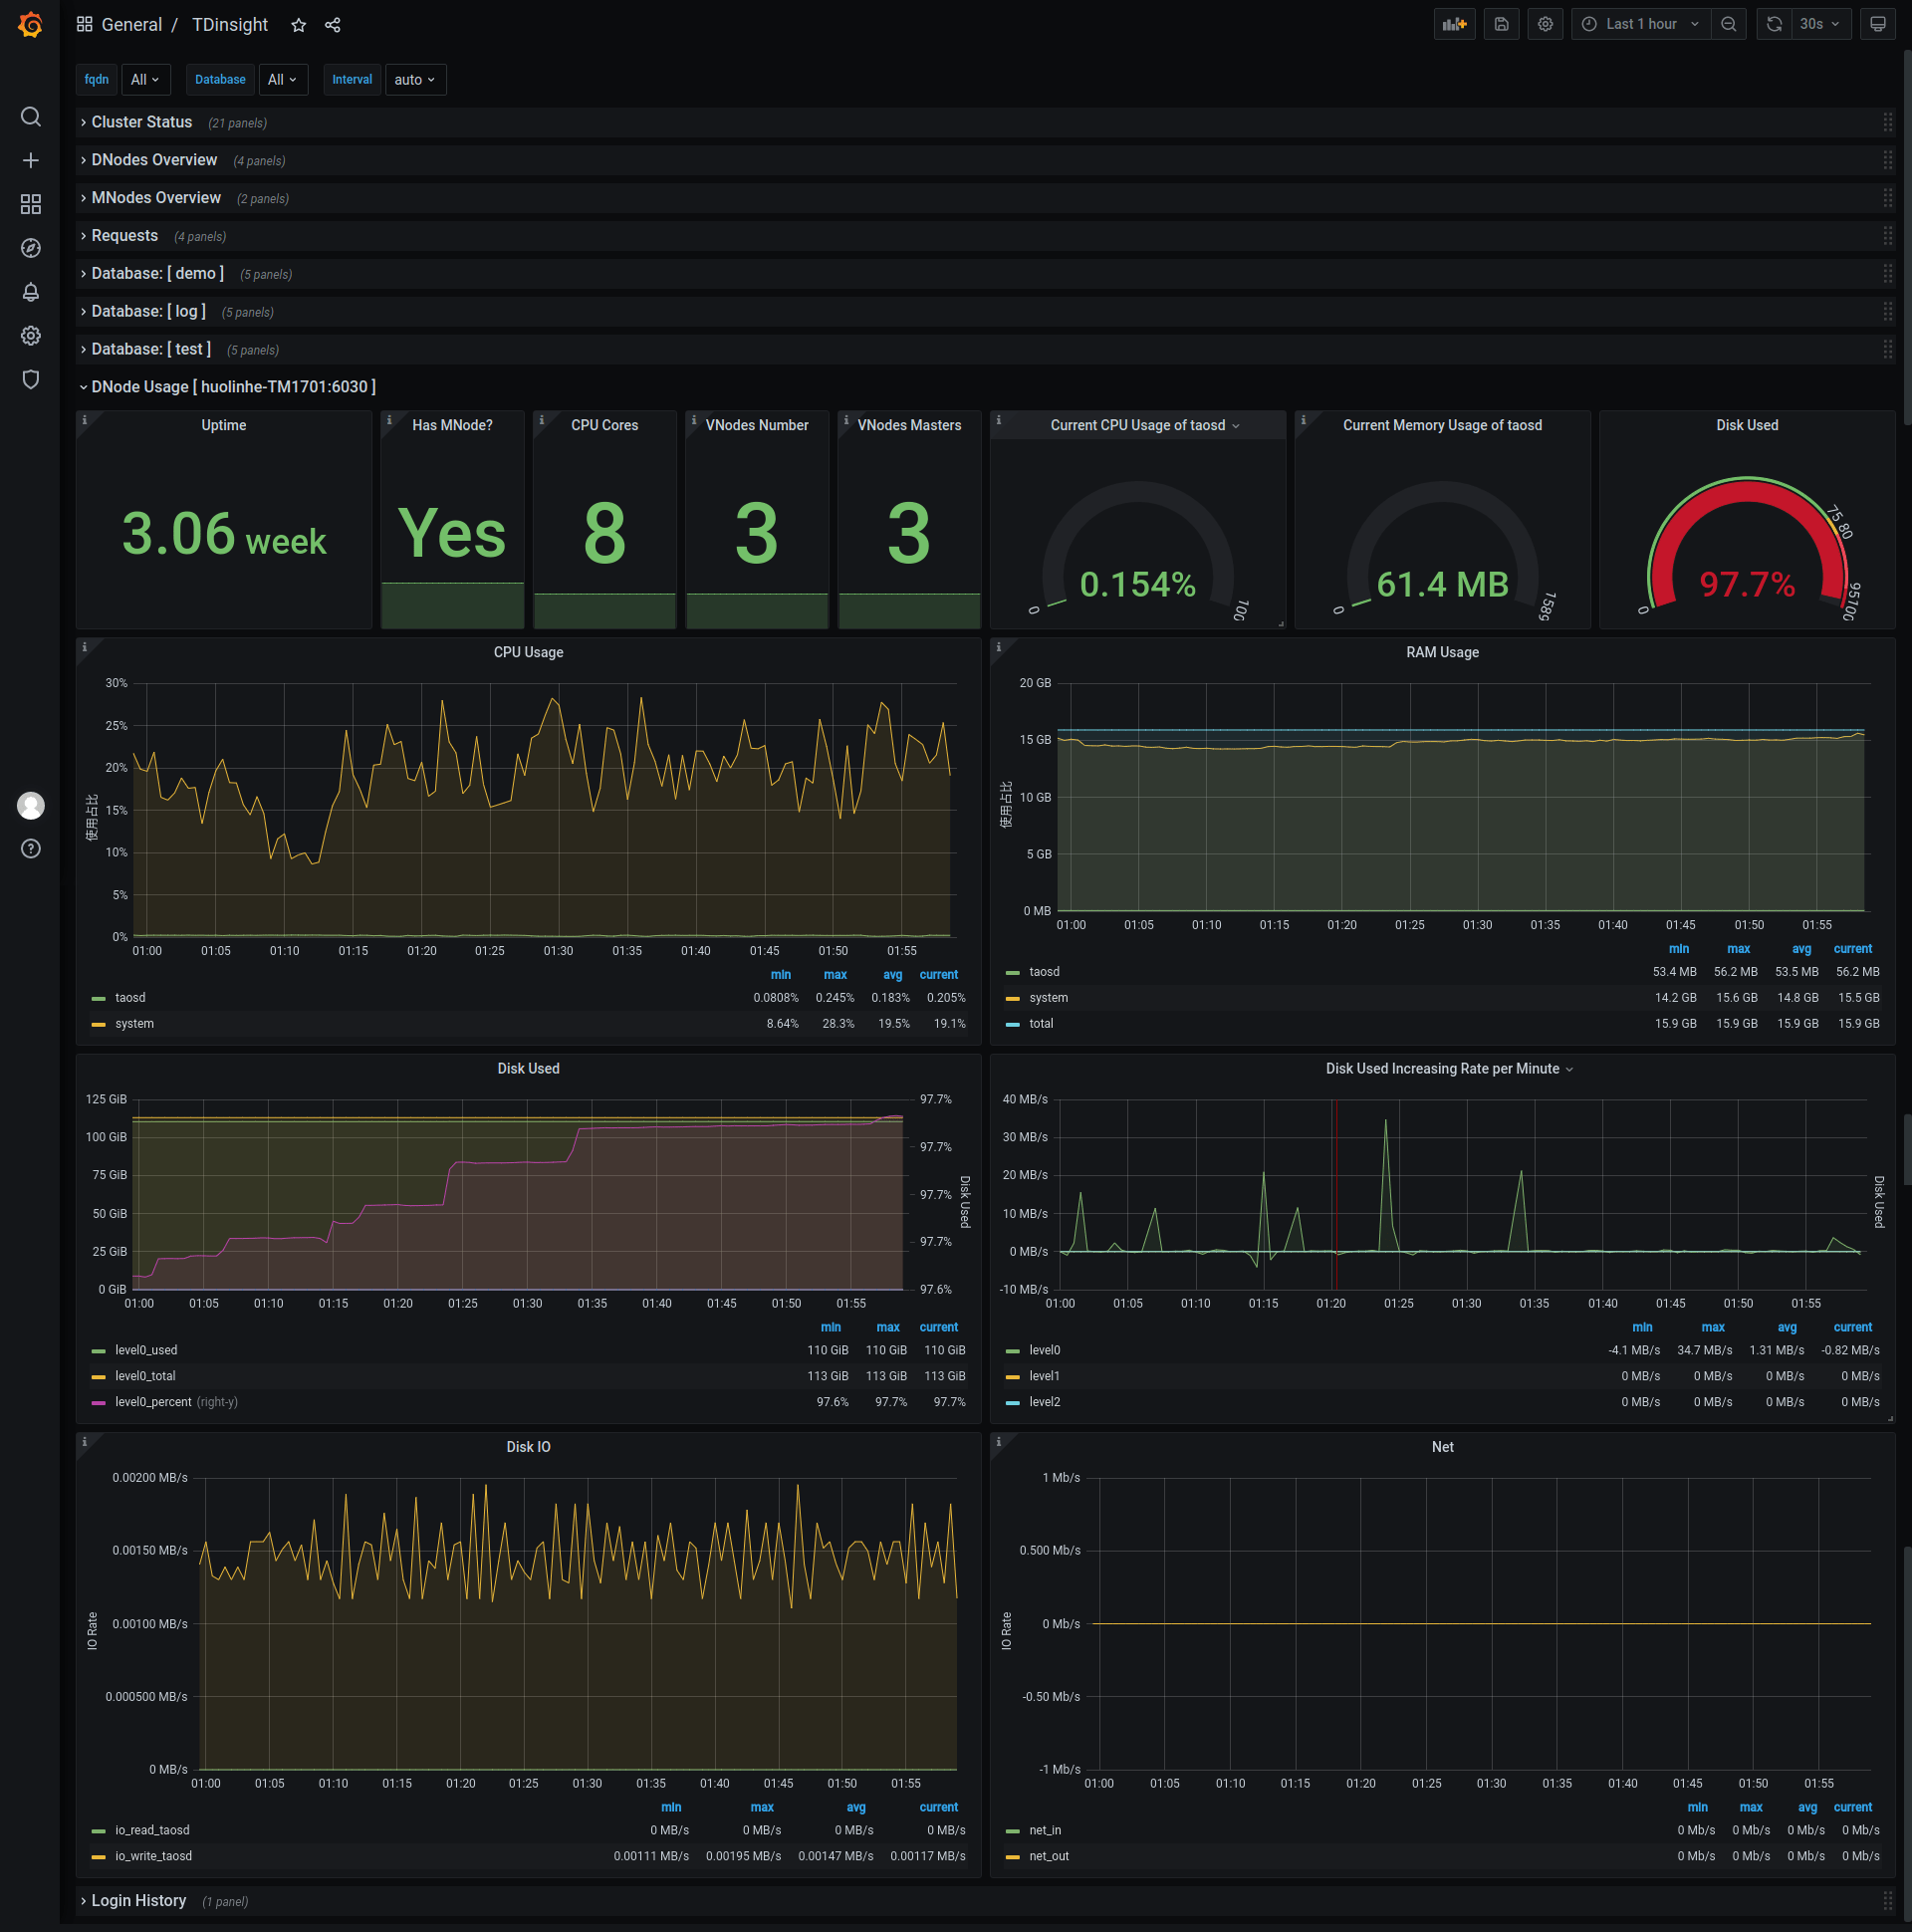
DNode resources details for specific node with grafana query type variable $fqdn (from select tbname from log.dn), including:
- Current memory usage, cpu usage, band speed, io read and write rate, disk used, etc.
- Max resources usage in last hour or some time.
- CPU graph view.
- Memory usage.
- Disk used percent: graph view with alert rule.
- Disk used.
- Requests count per minute.
- IO rate (read/write), with comparison to that in last hour.
Here's the metrics list:
- Uptime: Elapsed time from dnode created.
- Has MNodes?: If the dnodes has mnode.
- CPU Cores: Number of CPU cores.
- VNodes Number: VNodes number of the current dnode.
- VNodes Masters: The number of vnodes that are in master role.
- Current CPU Usage of taosd: CPU usage of taosd process.
- Current Memory Usage of taosd: Memory usage of taosd process.
- Disk Used: Total disk usage percent of taosd data directory.
- CPU Usage: Process and system CPU usage.
- RAM Usage: RAM used metrics time-series view.
- Disk Used: Disk used for each level.
- Disk Increasing Rate per Minute: Disk increasing rate per minute.
- Disk IO: Process read/write bytes time-series data and view.
- Net IO: Total in/out bits for all networks except lo.
Login History

Currently only report login count per minute.
TaosAdapter
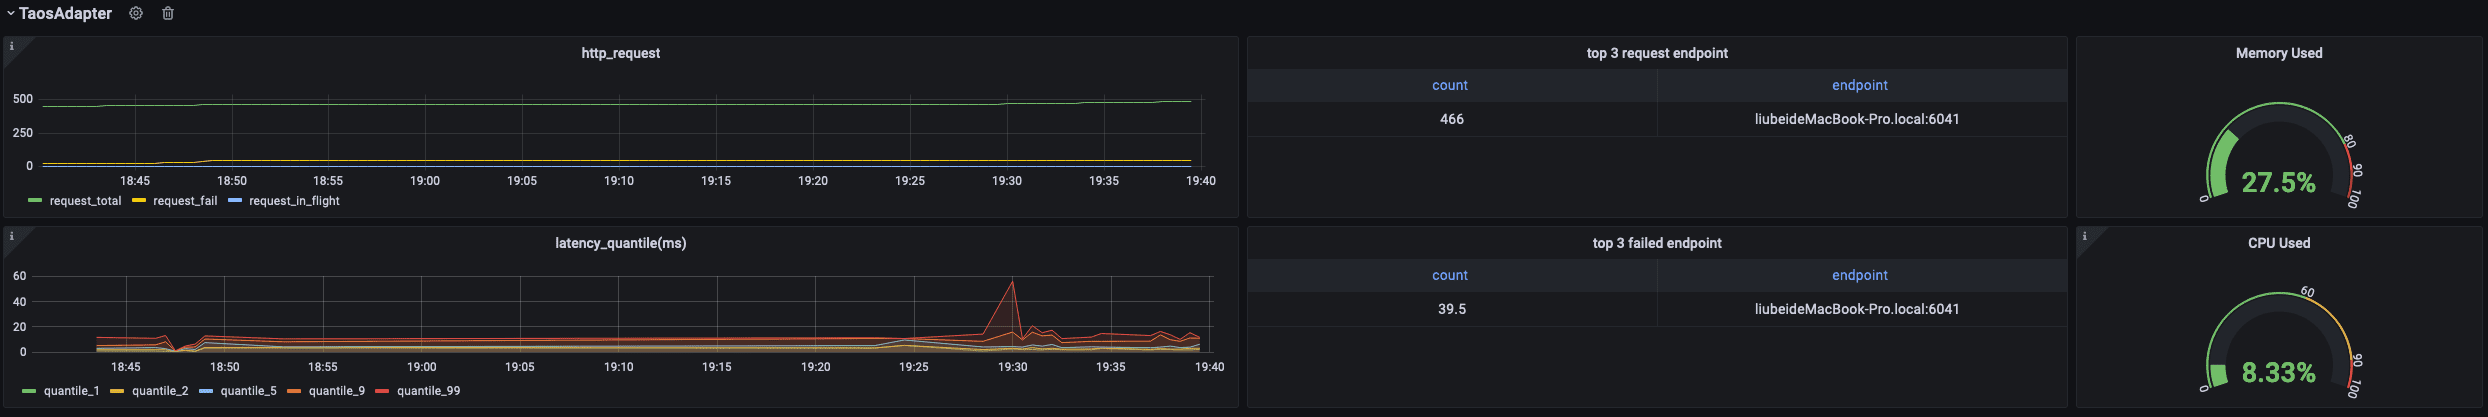
Includes taosAdapter http request statistics and status information
Here's the metrics list:
- http_request: include total http requests, failed http requests and http requests in flight.
- top 3 request endpoint: top 3 total requests number and the corresponding endpoint.
- Memory Used: taosAdapter memory usage
- latency_quantile(ms): Quantiles for each stages (1, 2, 5, 9, 99)
- top 3 failed request endpoint: top 3 request failure number and the corresponding endpoint.
- CPU Used: taosAdapter cpu usage
Upgrade
Reinstall with TDinsight.sh will upgrade Grafana plugin and TDinsight dashboard.
In other cases, users should install the new TDengine data source plugin first, then remove and install the new TDinsight dashboard.
Uninstall
With TDinsight.sh, just run TDinsight.sh -R to clean up all installed components.
Follow the next steps to clean up if you have installed TDinsight manually.
- Remove TDinsight dashboard in Grafana webpage.
- Remove TDengine from Grafana data sources.
- Remove the
tdengine-datasourceplugin from Grafana plugins directory.
An All-in-one Docker Example
git clone --depth 1 https://github.com/taosdata/grafanaplugin.git
cd grafanaplugin
Modify as needed in the docker-compose.yml file:
version: "3.7"

services:
  grafana:
    image: grafana/grafana:7.5.10
    volumes:
      - ./dist:/var/lib/grafana/plugins/tdengine-datasource
      - ./grafana/grafana.ini:/etc/grafana/grafana.ini
      - ./grafana/provisioning/:/etc/grafana/provisioning/
      - grafana-data:/var/lib/grafana
    environment:
      TDENGINE_API: ${TDENGINE_API}
      TDENGINE_USER: ${TDENGINE_USER}
      TDENGINE_PASS: ${TDENGINE_PASS}
      SMS_ACCESS_KEY_ID: ${SMS_ACCESS_KEY_ID}
      SMS_ACCESS_KEY_SECRET: ${SMS_ACCESS_KEY_SECRET}
      SMS_SIGN_NAME: ${SMS_SIGN_NAME}
      SMS_TEMPLATE_CODE: ${SMS_TEMPLATE_CODE}
      SMS_TEMPLATE_PARAM: "${SMS_TEMPLATE_PARAM}"
      SMS_PHONE_NUMBERS: $SMS_PHONE_NUMBERS
      SMS_LISTEN_ADDR: ${SMS_LISTEN_ADDR}
    ports:
      - 3000:3000

volumes:
  grafana-data:
Replace the environment variables in docker-compose.yml or set it .env, then start Grafana with docker-compose.
docker-compose up -d
TDinsight is builtin, please go to http://localhost:3000/d/tdinsight/ to see the dashboard.