Connections with Other Tools
Grafana
TDengine can be quickly integrated with Grafana, an open source data visualization system, to build a data monitoring and alarming system. The whole process does not require any code to write. The contents of the data table in TDengine can be visually showed on DashBoard.
Install Grafana
TDengine currently supports Grafana 7.0 and above. You can download and install the package from Grafana website according to the current operating system. The download address is as follows: https://grafana.com/grafana/download.
Configure Grafana
TDengine data source plugin for Grafana is hosted on GitHub, refer to GitHub latest release page to download the latest plugin package. Currently it's version 3.1.3 .
It is recommended to use grafana-cli command line tool to install the plugin.
sudo -u grafana grafana-cli \
  --pluginUrl https://github.com/taosdata/grafanaplugin/releases/download/v3.1.3/tdengine-datasource-3.1.3.zip \
  plugins install tdengine-datasource
Users could manually download the plugin package and install it to Grafana plugins directory.
GF_VERSION=3.1.3
wget https://github.com/taosdata/grafanaplugin/releases/download/v$GF_VERSION/tdengine-datasource-$GF_VERSION.zip
Taking CentOS 7.2 as an example, just unpack the package to /var/lib/grafana/plugins directory and restart Grafana.
sudo unzip tdengine-datasource-$GF_VERSION.zip /var/lib/grafana/plugins/
Grafana will check the signature after 7.3 and 8.x for security. Users need additional configurations in grafana.ini file to allow unsigned plugins like TDengine data source.
[plugins]
allow_loading_unsigned_plugins = tdengine-datasource
In docker/compose/k8s, simply setting the two environment variables will take it all for you.
GF_INSTALL_PLUGINS=https://github.com/taosdata/grafanaplugin/releases/download/v3.1.3/tdengine-datasource-3.1.3.zip;tdengine-datasource
GF_PLUGINS_ALLOW_LOADING_UNSIGNED_PLUGINS=tdengine-datasource
Use Grafana
Configure data source
You can log in the Grafana server (username/password:admin/admin) through localhost:3000, and add data sources through Configuration -> Data Sources on the left panel, as shown in the following figure:
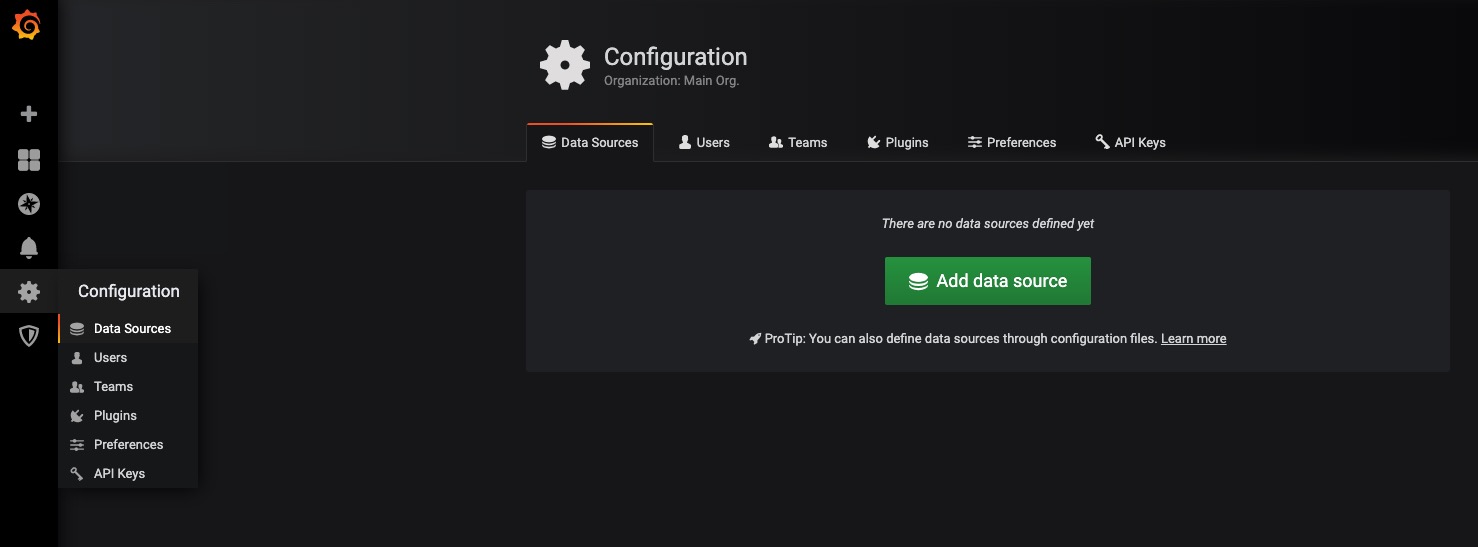
Click Add data source to enter the Add Data Source page, and enter TDengine in the query box to select Add, as shown in the following figure:

Enter the data source configuration page and modify the corresponding configuration according to the default prompt:
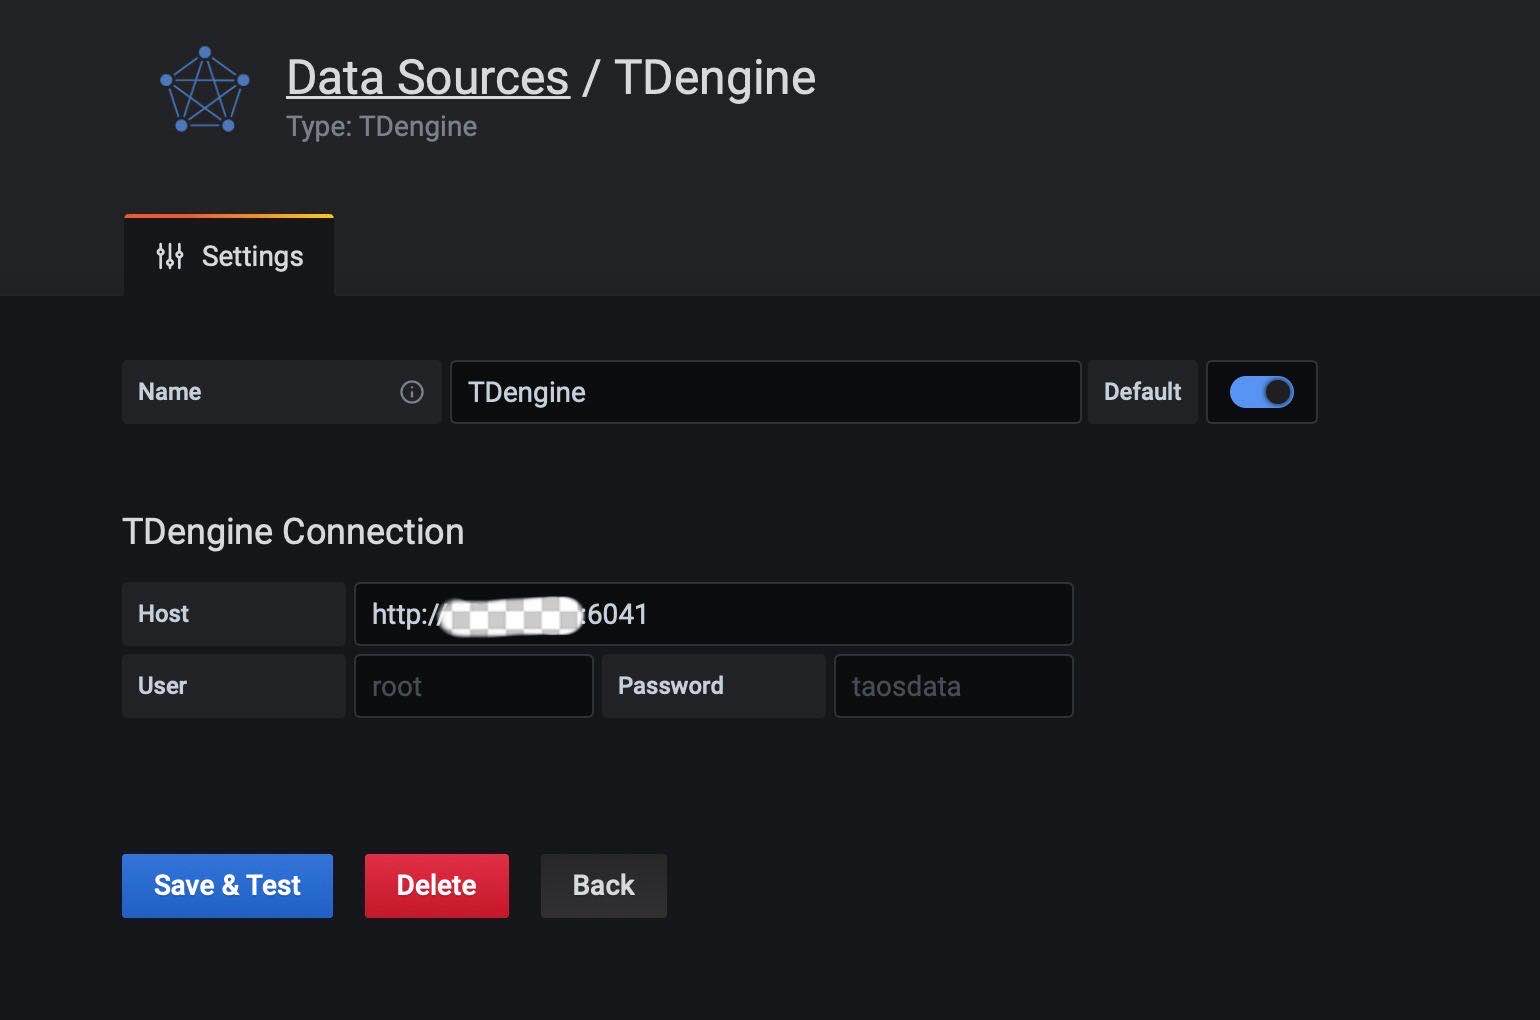
- Host: IP address of any server in TDengine cluster and port number of TDengine RESTful interface (6041), use
http://localhost:6041to access the interface by default. Note the 2.4 and later version of TDengine use a stand-alone software, taosAdapter to provide RESTful interface. Please refer to its document for configuration and deployment. - User: TDengine username.
- Password: TDengine user password.
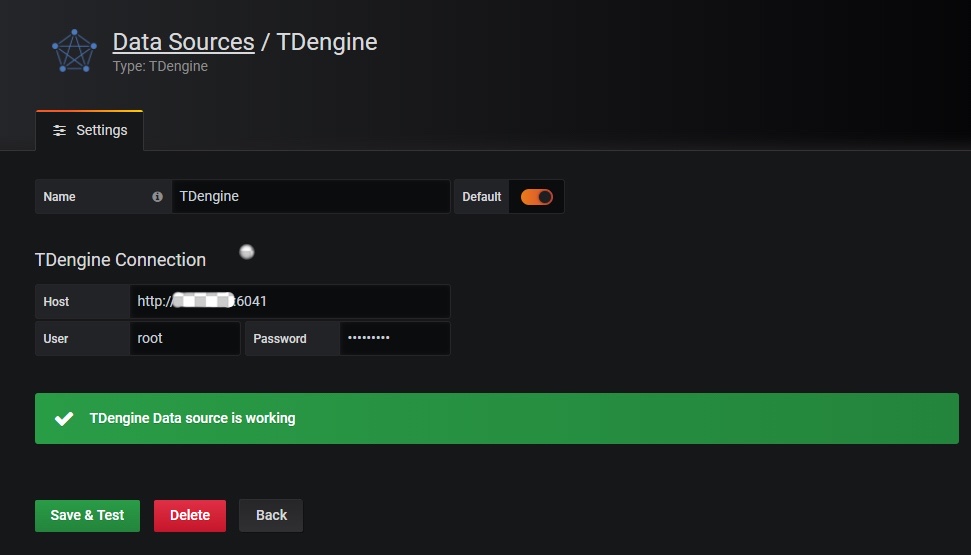
Click Save & Test to test. Success will be prompted as follows:
Create Dashboard
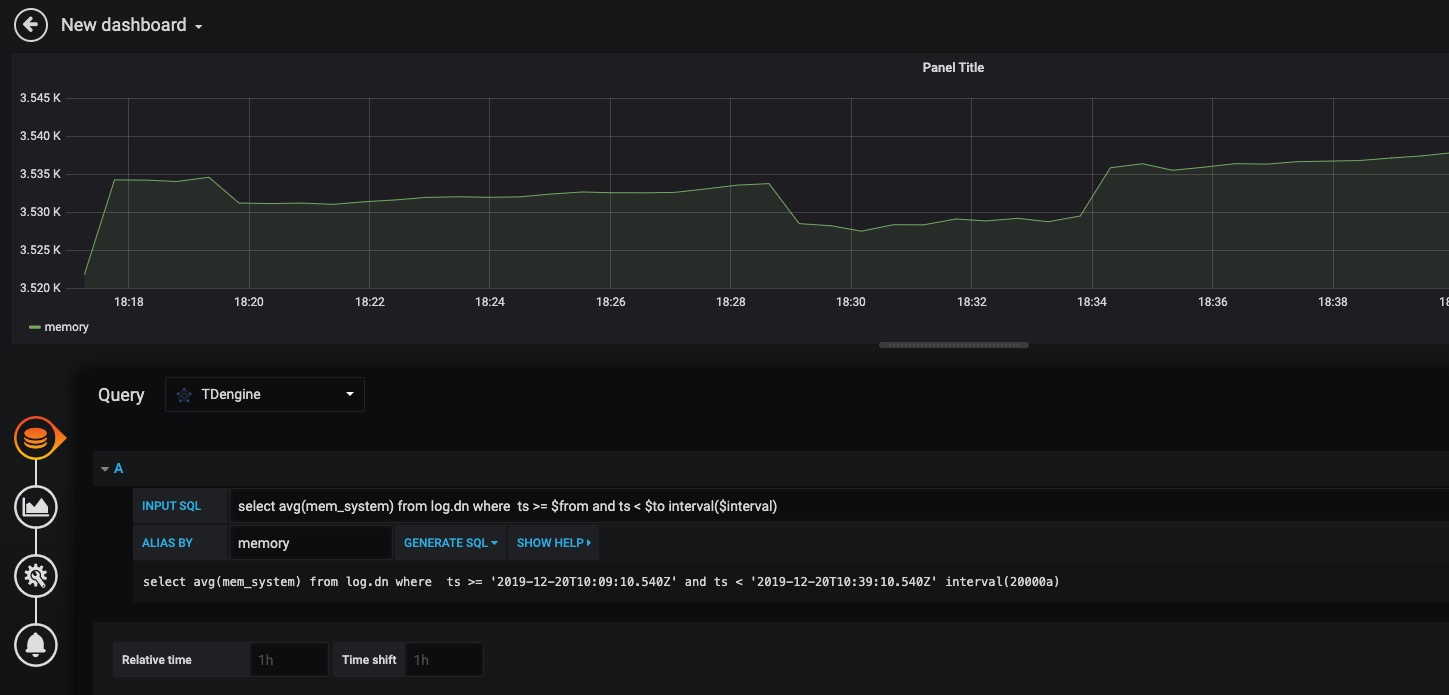
Go back to the home to create Dashboard, and click Add Query to enter the panel query page:
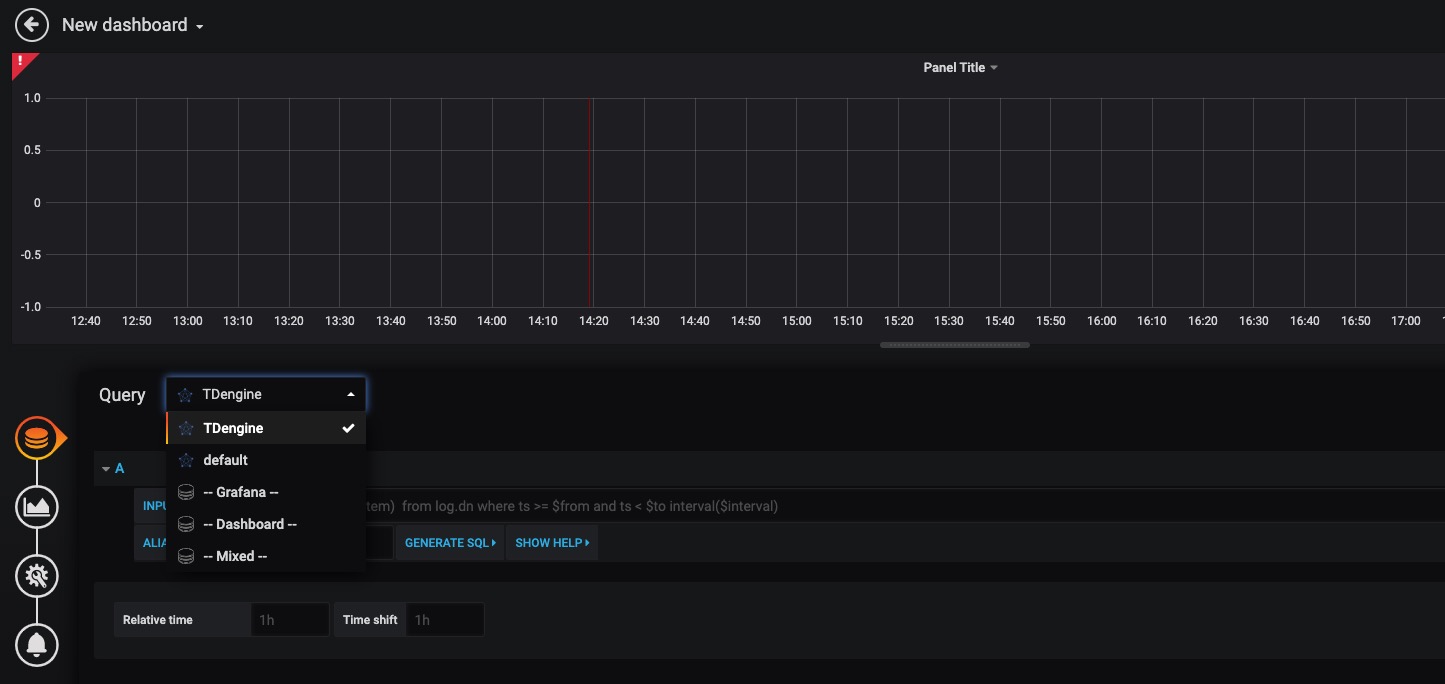
As shown in the figure above, select the TDengine data source in Query, and enter the corresponding sql in the query box below to query. Details are as follows:
- INPUT SQL: Enter the statement to query (the result set of the SQL statement should be two columns and multiple rows), for example:
select avg(mem_system) from log.dn where ts >= $from and ts < $to interval($interval), wherefrom,toandintervalare built-in variables of the TDengine plug-in, representing the query range and time interval obtained from the Grafana plug-in panel. In addition to built-in variables, it is also supported to use custom template variables. - ALIAS BY: You can set alias for the current queries.
- GENERATE SQL: Clicking this button will automatically replace the corresponding variable and generate the final statement to execute.
According to the default prompt, query the average system memory usage at the specified interval of the server where the current TDengine deployed in as follows:
Please refer to Grafana documents for how to use Grafana to create the corresponding monitoring interface and for more about Grafana usage.
Import Dashboard
We provide a TDinsight dashboard (via Grafana dashboard id: 15167) for TDengine cluster monitoring since TDengine 2.3.3.x . Please refer to TDinsight User Manual for the details.
MATLAB
MATLAB can access data to the local workspace by connecting directly to the TDengine via the JDBC Driver provided in the installation package.
JDBC Interface Adaptation of MATLAB
Several steps are required to adapt MATLAB to TDengine. Taking adapting MATLAB2017a on Windows10 as an example:
-
Please download TDengine JDBC driver dist jar file from maven.org or other maven.org's mirrors site and copy it to the directory <matlab-root>\MATLAB\R2017a\java\jar\toolbox
-
Copy the file taos.lib from TDengine installation package to <matlab-root>\MATLAB\R2017a\lib\win64
-
Add the .jar package just copied to the MATLAB classpath. Append the line below as the end of the file of <matlab-root>\MATLAB\R2017a\toolbox\local\classpath.txt
$matlabroot/java/jar/toolbox/JDBCDriver-x.x.x-dist.jar -
Create a file called javalibrarypath.txt in directory <user_home>\AppData\Roaming\MathWorks\MATLAB\R2017a_, and add the _taos.dll path in the file. For example, if the file taos.dll is in the directory of C:\Windows\System32,then add the following line in file javalibrarypath.txt:
C:\Windows\System32 -
Connect to TDengine in MATLAB to get data
After the above configured successfully, open MATLAB.
- Create a connection:
conn = database(‘db’, ‘root’, ‘taosdata’, ‘com.taosdata.jdbc.TSDBDriver’, ‘jdbc:TSDB://127.0.0.1:0/’)
- Make a query:
sql0 = [‘select * from tb’]
data = select(conn, sql0);
- Insert a record:
sql1 = [‘insert into tb values (now, 1)’]
exec(conn, sql1)
For more detailed examples, please refer to the examples\matlab\TDengineDemo.m file in the package.
R
R language supports connection to the TDengine database through the JDBC interface. First, you need to install the JDBC package of R language. Its dependencies such as DBI and rJava will be automatically downloaded too. Launch the R language environment, and then execute the following command to install the JDBC support library for R language:
install.packages('RJDBC', repos='http://cran.us.r-project.org')
After installed, load the DBI, rJava and RJDBC package by executing library() command.
library('DBI')
library('rJava')
library('RJDBC')
Then load the TDengine JDBC driver:
drv<-JDBC("com.taosdata.jdbc.TSDBDriver","JDBCDriver-2.0.0-dist.jar", identifier.quote="\"")
If succeed, no error message will display. Then use the following command to try a database connection:
conn<-dbConnect(drv,"jdbc:TSDB://127.0.0.1:0/?user=root&password=taosdata","root","taosdata")
Or you can use the RESTful interface to access TDengine.
conn<-dbConnect(drv,"jdbc:TAOS-RS://127.0.0.1:6041/test?user=root&password=taosdata","root","taosdata")
Please replace the IP address in the command above to the correct one. If no error message is shown, then the connection is established successfully, otherwise the connection command needs to be adjusted according to the error prompt. TDengine supports below functions in RJDBC package:
dbWriteTable(conn, "test", iris, overwrite=FALSE, append=TRUE): Write the data in a data frame iris to the table test in the TDengine server. Parameter overwrite must be false. append must be TRUE and the schema of the data frame iris should be the same as the table test.dbGetQuery(conn, "select count(*) from test"): run a query commanddbSendUpdate (conn, "use db"): Execute any non-query sql statement. For example,dbSendUpdate (conn, "use db"), write datadbSendUpdate (conn, "insert into t1 values (now, 99)"), and the like.dbReadTable(conn, "test"): read all the data in table testdbDisconnect(conn): close a connectiondbRemoveTable(conn, "test"): remove table test