Seeq
Seeq is advanced analytics software for the manufacturing and Industrial Internet of Things (IIOT). Seeq supports innovative new features using machine learning in process manufacturing organizations. These features enable organizations to deploy their own or third-party machine learning algorithms to advanced analytics applications used by frontline process engineers and subject matter experts, thus extending the efforts of a single data scientist to many frontline staff.
Through the TDengine Java connector, Seeq can easily support querying time-series data provided by TDengine and offer data presentation, analysis, prediction, and other functions.
Prerequisites
- TDengine 3.1.0.3 and above version is installed and running normally (both Enterprise and Community versions are available).
- taosAdapter is running normally, refer to taosAdapter Reference.
- Seeq has been installed. Download the relevant software from Seeq's official website, such as
Seeq ServerandSeeq Data Lab, etc.Seeq Data Labneeds to be installed on a different server fromSeeq Serverand interconnected through configuration. For detailed installation and configuration instructions, refer to the Seeq Knowledge Base. - Install the JDBC driver. Download the
TDengine JDBC connectorfiletaos-jdbcdriver-3.2.5-dist.jaror a higher version frommaven.org.
Configure Data Source
Step 1, Check the data storage location
sudo seeq config get Folders/Data
Step 2, Download the TDengine Java connector package from maven.org and copy it to the plugins\lib directory in the data storage location.
Step 3, Restart seeq server
sudo seeq restart
Step 4, Enter License
Use a browser to visit ip:34216 and follow the instructions to enter the license.
Data Analysis
Scenario Introduction
The example scenario is a power system where users collect electricity usage data from power station instruments daily and store it in the TDengine cluster. Now, users want to predict how power consumption will develop and purchase more equipment to support it. User power consumption varies with monthly orders, and considering seasonal changes, power consumption will differ. This city is located in the northern hemisphere, so more electricity is used in summer. We simulate data to reflect these assumptions.
Data preparation
Step 1, Create tables in TDengine.
CREATE STABLE meters (ts TIMESTAMP, num INT, temperature FLOAT, goods INT) TAGS (device NCHAR(20));
CREATE TABLE goods (ts1 TIMESTAMP, ts2 TIMESTAMP, goods FLOAT);

Step 2, Construct data in TDengine.
python mockdata.py
taos -s "insert into power.goods select _wstart, _wstart + 10d, avg(goods) from power.meters interval(10d);"
The source code is hosted on GitHub Repository.
Step 3, Log in using a Seeq administrator role account and create a new data source.
- Power
{
    "QueryDefinitions": [
        {
            "Name": "PowerNum",
            "Type": "SIGNAL",
            "Sql": "SELECT  ts, num FROM meters",
            "Enabled": true,
            "TestMode": false,
            "TestQueriesDuringSync": true,
            "InProgressCapsulesEnabled": false,
            "Variables": null,
            "Properties": [
                {
                    "Name": "Name",
                    "Value": "Num",
                    "Sql": null,
                    "Uom": "string"
                },
                {
                    "Name": "Interpolation Method",
                    "Value": "linear",
                    "Sql": null,
                    "Uom": "string"
                },
                {
                    "Name": "Maximum Interpolation",
                    "Value": "2day",
                    "Sql": null,
                    "Uom": "string"
                }
            ],
            "CapsuleProperties": null
        }
    ],
    "Type": "GENERIC",
    "Hostname": null,
    "Port": 0,
    "DatabaseName": null,
    "Username": "root",
    "Password": "taosdata",
    "InitialSql": null,
    "TimeZone": null,
    "PrintRows": false,
    "UseWindowsAuth": false,
    "SqlFetchBatchSize": 100000,
    "UseSSL": false,
    "JdbcProperties": null,
    "GenericDatabaseConfig": {
        "DatabaseJdbcUrl": "jdbc:TAOS-RS://127.0.0.1:6041/power?user=root&password=taosdata",
        "SqlDriverClassName": "com.taosdata.jdbc.rs.RestfulDriver",
        "ResolutionInNanoseconds": 1000,
        "ZonedColumnTypes": []
    }
}
- Goods
{
    "QueryDefinitions": [
        {
            "Name": "PowerGoods",
            "Type": "CONDITION",
            "Sql": "SELECT ts1, ts2, goods FROM power.goods",
            "Enabled": true,
            "TestMode": false,
            "TestQueriesDuringSync": true,
            "InProgressCapsulesEnabled": false,
            "Variables": null,
            "Properties": [
                {
                    "Name": "Name",
                    "Value": "Goods",
                    "Sql": null,
                    "Uom": "string"
                },
                {
                    "Name": "Maximum Duration",
                    "Value": "10days",
                    "Sql": null,
                    "Uom": "string"
                }
            ],
            "CapsuleProperties": [
                {
                    "Name": "goods",
                    "Value": "${columnResult}",
                    "Column": "goods",
                    "Uom": "string"
                }
            ]
        }
    ],
    "Type": "GENERIC",
    "Hostname": null,
    "Port": 0,
    "DatabaseName": null,
    "Username": "root",
    "Password": "taosdata",
    "InitialSql": null,
    "TimeZone": null,
    "PrintRows": false,
    "UseWindowsAuth": false,
    "SqlFetchBatchSize": 100000,
    "UseSSL": false,
    "JdbcProperties": null,
    "GenericDatabaseConfig": {
        "DatabaseJdbcUrl": "jdbc:TAOS-RS://127.0.0.1:6041/power?user=root&password=taosdata",
        "SqlDriverClassName": "com.taosdata.jdbc.rs.RestfulDriver",
        "ResolutionInNanoseconds": 1000,
        "ZonedColumnTypes": []
    }
}
- Temperature
{
    "QueryDefinitions": [
        {
            "Name": "PowerNum",
            "Type": "SIGNAL",
            "Sql": "SELECT  ts, temperature FROM meters",
            "Enabled": true,
            "TestMode": false,
            "TestQueriesDuringSync": true,
            "InProgressCapsulesEnabled": false,
            "Variables": null,
            "Properties": [
                {
                    "Name": "Name",
                    "Value": "Temperature",
                    "Sql": null,
                    "Uom": "string"
                },
                {
                    "Name": "Interpolation Method",
                    "Value": "linear",
                    "Sql": null,
                    "Uom": "string"
                },
                {
                    "Name": "Maximum Interpolation",
                    "Value": "2day",
                    "Sql": null,
                    "Uom": "string"
                }
            ],
            "CapsuleProperties": null
        }
    ],
    "Type": "GENERIC",
    "Hostname": null,
    "Port": 0,
    "DatabaseName": null,
    "Username": "root",
    "Password": "taosdata",
    "InitialSql": null,
    "TimeZone": null,
    "PrintRows": false,
    "UseWindowsAuth": false,
    "SqlFetchBatchSize": 100000,
    "UseSSL": false,
    "JdbcProperties": null,
    "GenericDatabaseConfig": {
        "DatabaseJdbcUrl": "jdbc:TAOS-RS://127.0.0.1:6041/power?user=root&password=taosdata",
        "SqlDriverClassName": "com.taosdata.jdbc.rs.RestfulDriver",
        "ResolutionInNanoseconds": 1000,
        "ZonedColumnTypes": []
    }
}
Using Seeq Workbench
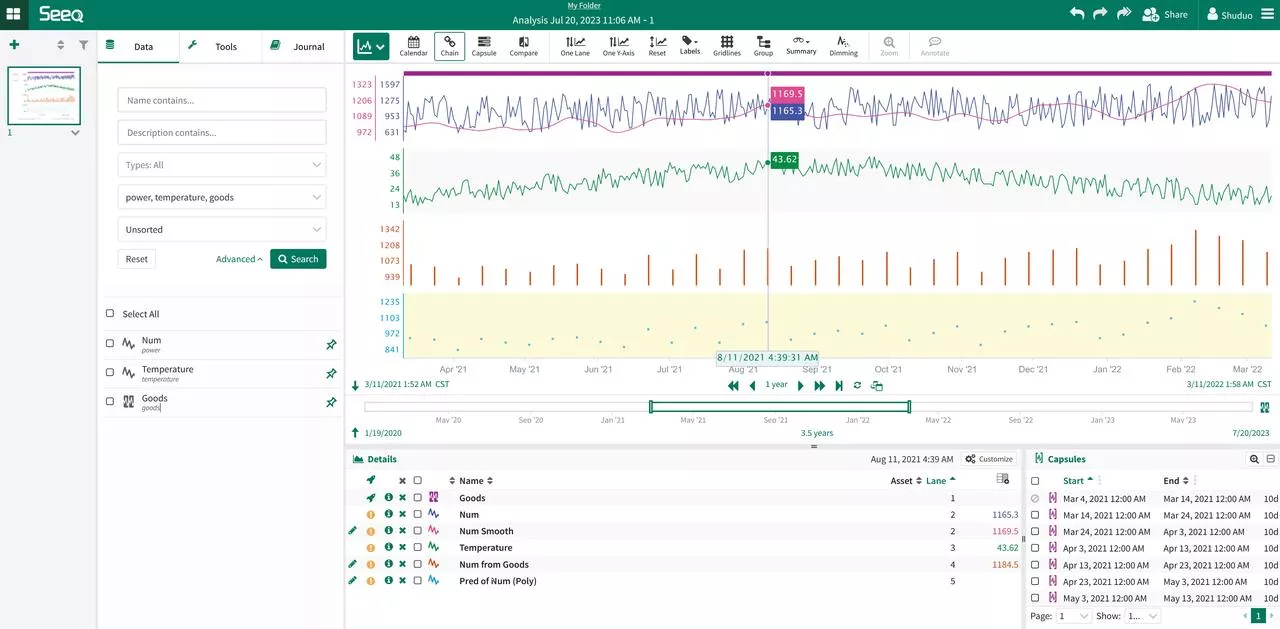
Log in to the Seeq service page and create a new Seeq Workbench. By selecting data sources from search results and choosing different tools as needed, you can display data or make predictions. For detailed usage methods, refer to the official knowledge base.

Further Data Analysis with Seeq Data Lab Server
Log in to the Seeq service page and create a new Seeq Data Lab, where you can use Python programming or other machine learning tools for more complex data mining functions.
from seeq import spy
spy.options.compatibility = 189
import pandas as pd
import matplotlib
import matplotlib.pyplot as plt
import mlforecast
import lightgbm as lgb
from mlforecast.target_transforms import Differences
from sklearn.linear_model import LinearRegression

ds = spy.search({'ID': "8C91A9C7-B6C2-4E18-AAAF-XXXXXXXXX"})
print(ds)

sig = ds.loc[ds['Name'].isin(['Num'])]
print(sig)

data = spy.pull(sig, start='2015-01-01', end='2022-12-31', grid=None)
print("data.info()")
data.info()
print(data)
#data.plot()

print("data[Num].info()")
data['Num'].info()
da = data['Num'].index.tolist()
#print(da)

li = data['Num'].tolist()
#print(li)

data2 = pd.DataFrame()
data2['ds'] = da
print('1st data2 ds info()')
data2['ds'].info()

#data2['ds'] = pd.to_datetime(data2['ds']).to_timestamp()
data2['ds'] = pd.to_datetime(data2['ds']).astype('int64')
data2['y'] = li
print('2nd data2 ds info()')
data2['ds'].info()
print(data2)

data2.insert(0, column = "unique_id", value="unique_id")

print("Forecasting ...")

forecast = mlforecast.MLForecast(
    models = lgb.LGBMRegressor(),
    freq = 1,
    lags=[365],
    target_transforms=[Differences([365])],
)

forecast.fit(data2)
predicts = forecast.predict(365)

pd.concat([data2, predicts]).set_index("ds").plot(title = "current data with forecast")
plt.show()
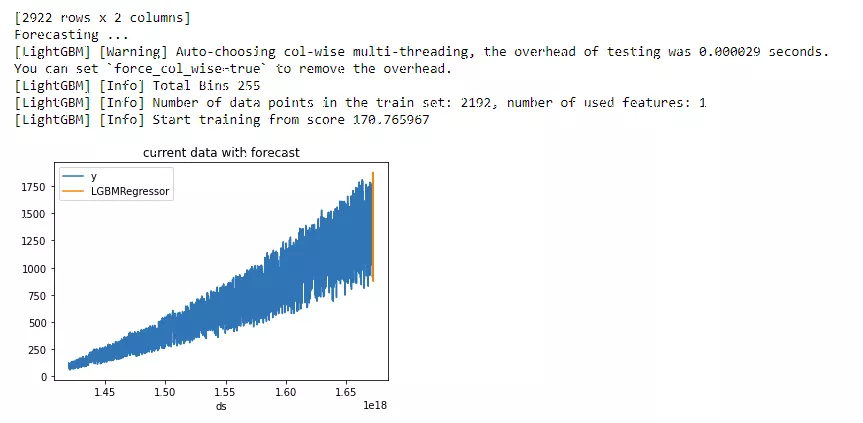
Program output results:

Solution Summary
By integrating Seeq and TDengine, users can fully leverage the efficient storage and querying capabilities of TDengine, while also benefiting from the powerful data visualization and analysis features provided by Seeq.
This integration enables users to fully utilize TDengine's high-performance time-series data storage and retrieval, ensuring efficient handling of large volumes of data. Meanwhile, Seeq offers advanced analytical features such as data visualization, anomaly detection, correlation analysis, and predictive modeling, allowing users to gain valuable insights and make data-driven decisions.
Overall, Seeq and TDengine together provide a comprehensive solution for time-series data analysis across various industries such as manufacturing, industrial IoT, and power systems. The combination of efficient data storage and advanced analytics empowers users to fully exploit the potential of time-series data, driving operational improvements, and supporting predictive and planning analysis applications.