Anomaly Detection
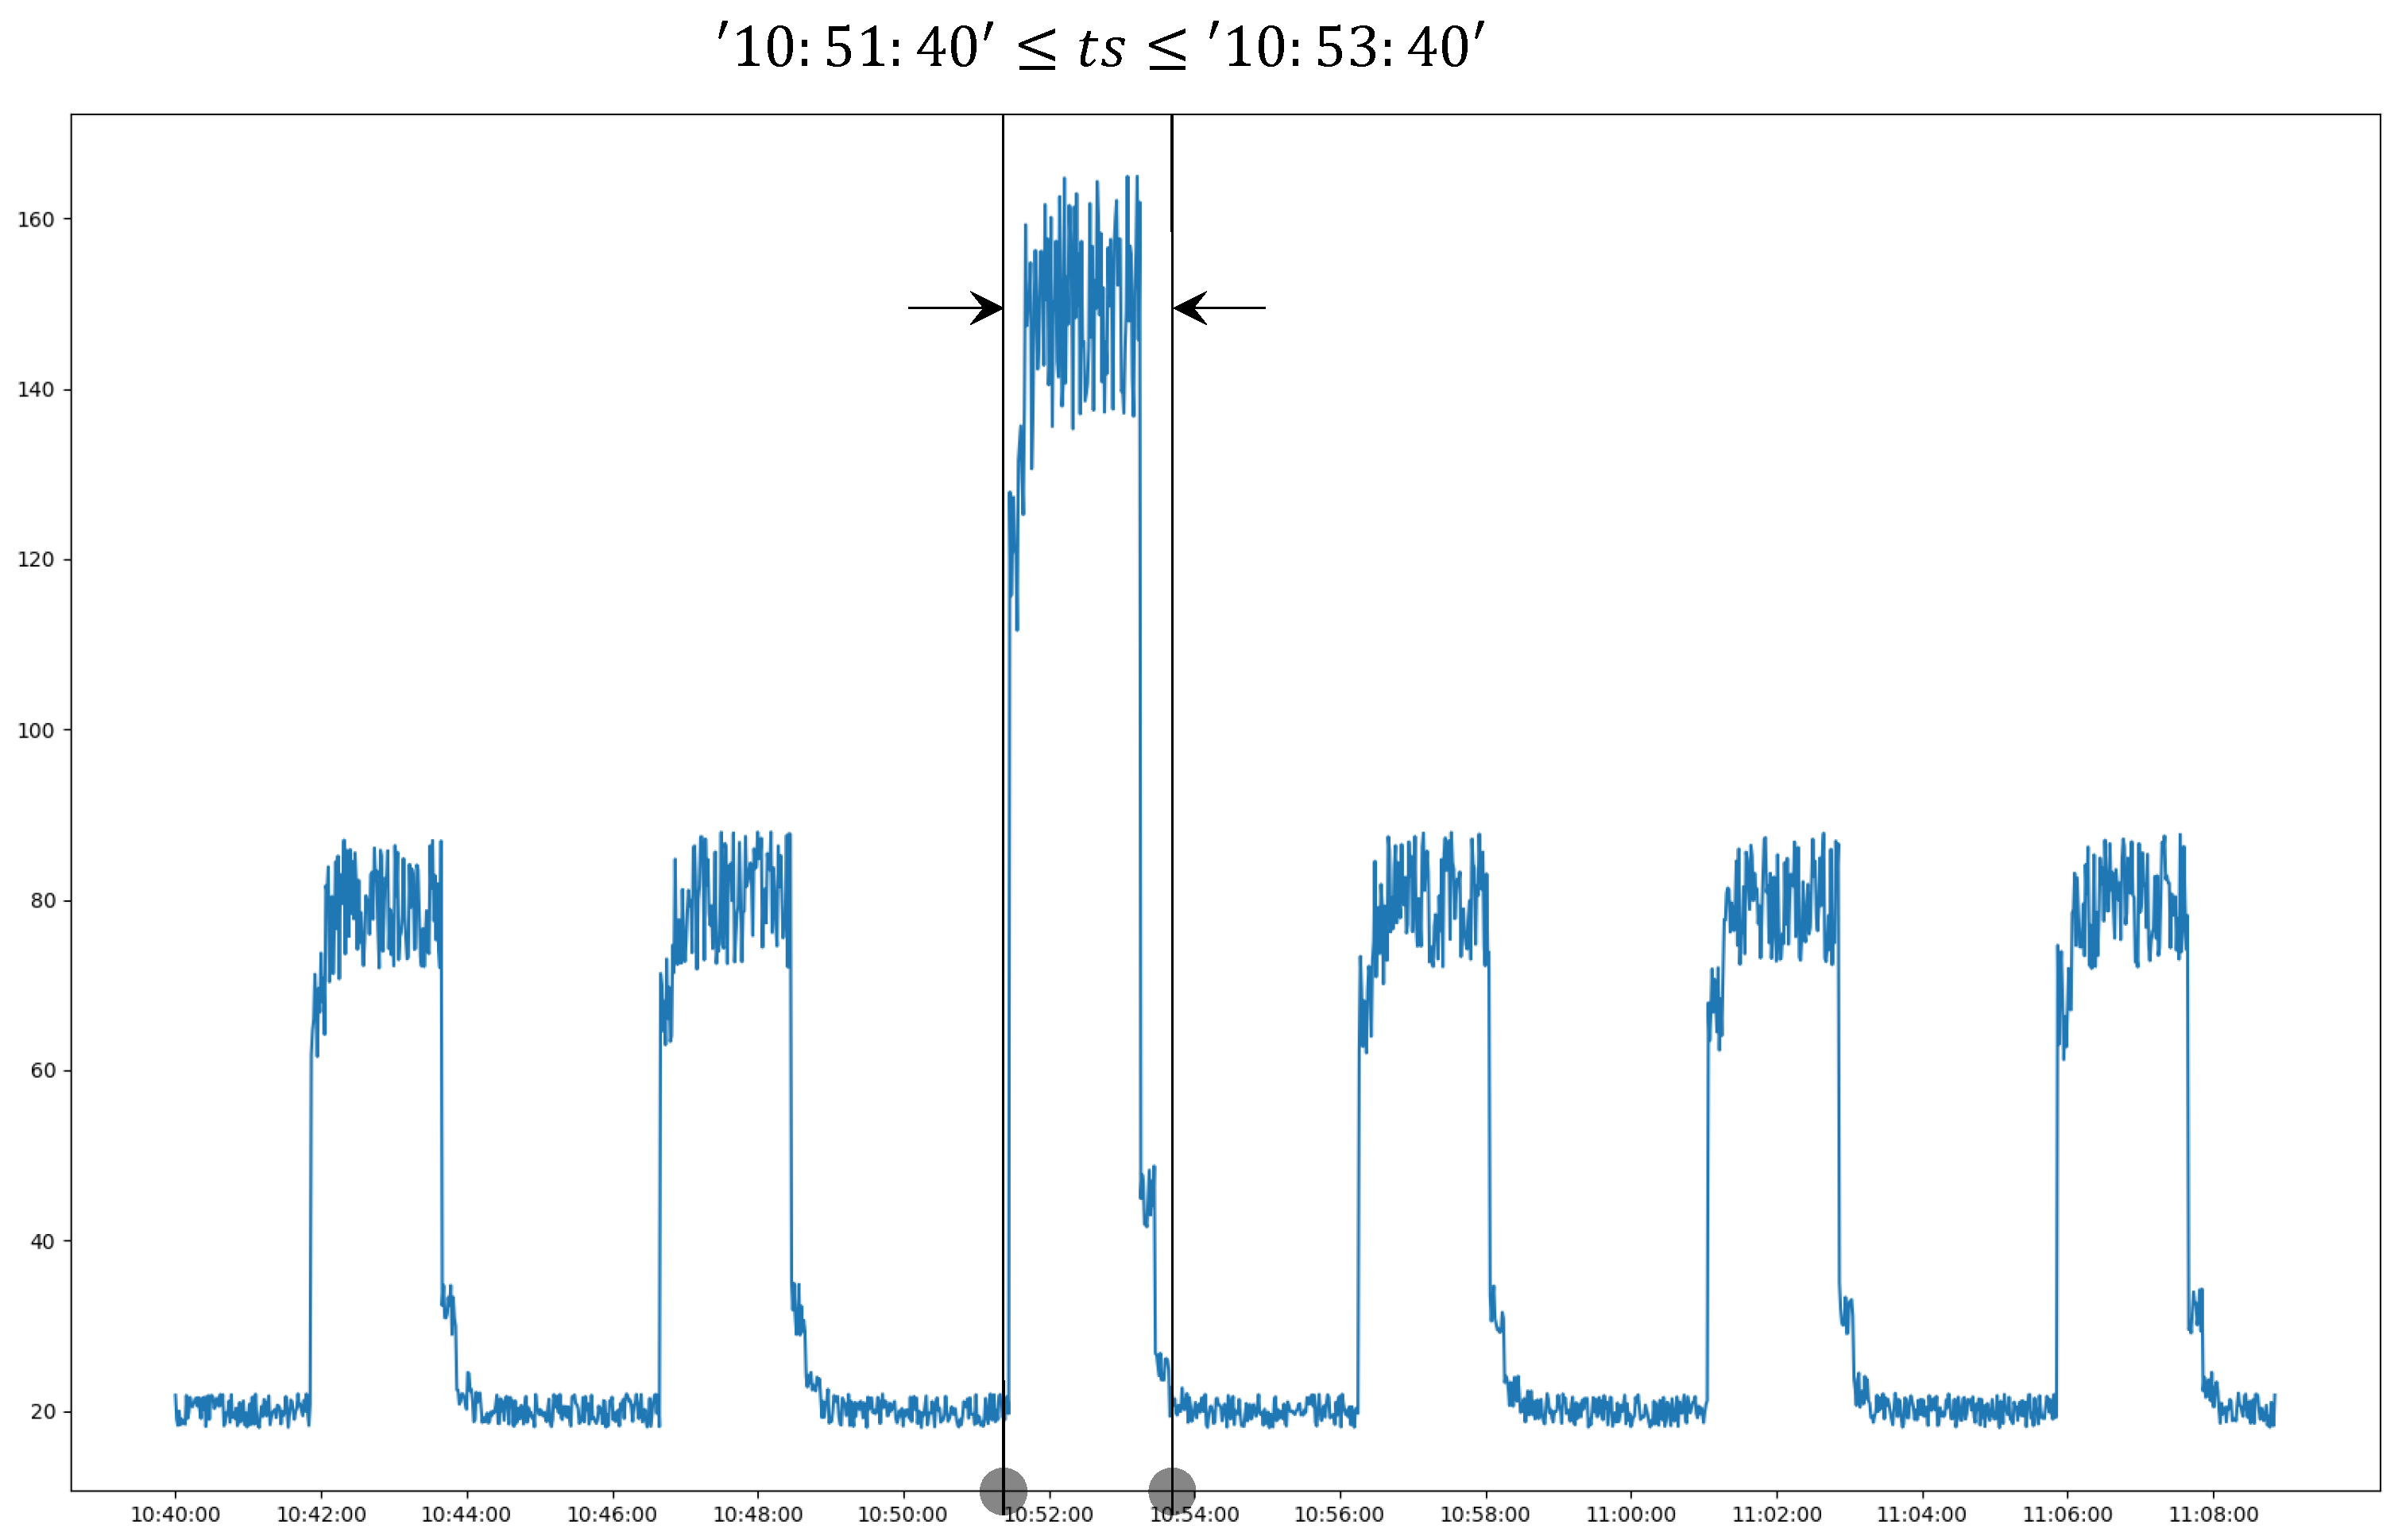
This service is provided via an anomaly window that has been introduced into TDengine. An anomaly window is a special type of event window, defined by the anomaly detection algorithm as a time window during which an anomaly is occurring. This window differs from an event window in that the algorithm determines when it opens and closes instead of expressions input by the user. You can use the ANOMALY_WINDOW keyword in a WHERE clause to invoke the anomaly detection service. The window pseudocolumns _WSTART, _WEND, and _WDURATION record the start, end, and duration of the window. For example:
--- Use the IQR algorithm to detect anomalies in the `col_val` column. Also return the start and end time of the anomaly window as well as the sum of the `col` column within the window.
SELECT _wstart, _wend, SUM(col)
FROM foo
ANOMALY_WINDOW(col_val, "algo=iqr");
As shown in the following figure, the anode returns the anomaly window [10:51:30, 10:53:40].

You can then query, aggregate, or perform other operations on the data in the window.
Syntax
ANOMALY_WINDOW(column_name, option_expr)

option_expr: {"
algo=expr1
[,wncheck=1|0]
[,expr2]
"}
column_name: The data column in which to detect anomalies. Specify only one column per query. The data type of the column must be numerical; string types such as NCHAR are not supported. Functions are not supported.options: The parameters for anomaly detection. Enter parameters in key=value format, separating multiple parameters with a comma (,). It is not necessary to use quotation marks or escape characters. Only ASCII characters are supported. For example:algo=ksigma,k=2indicates that the anomaly detection algorithm is k-sigma and the k value is 2.- You can use the results of anomaly detection as the inner part of a nested query. The same functions are supported as in other windowed queries.
- White noise checking is performed on the input data by default. If the input data is white noise, no results are returned.
Parameter Description
| Parameter | Definition | Default |
|---|---|---|
| algo | Specify the anomaly detection algorithm. | iqr |
| wncheck | Enter 1 to perform the white noise data check or 0 to disable the white noise data check. | 1 |
Example
--- Use the IQR algorithm to detect anomalies in the `i32` column.
SELECT _wstart, _wend, SUM(i32)
FROM foo
ANOMALY_WINDOW(i32, "algo=iqr");

--- Use the k-sigma algorithm with k value of 2 to detect anomalies in the `i32`
SELECT _wstart, _wend, SUM(i32)
FROM foo
ANOMALY_WINDOW(i32, "algo=ksigma,k=2");

taos> SELECT _wstart, _wend, count(*) FROM foo ANOMALY_WINDOW(i32);
         _wstart         |          _wend          |   count(*)    |
====================================================================
 2020-01-01 00:00:16.000 | 2020-01-01 00:00:17.000 |             2 |
Query OK, 1 row(s) in set (0.028946s)
Built-In Anomaly Detection Algorithms
TDgpt comes with six anomaly detection algorithms, divided among the following three categories: Statistical Algorithms, Data Density Algorithms, and Machine Learning Algorithms. If you do not specify an algorithm, the IQR algorithm is used by default.
Evaluating Algorithm Effectiveness
TDgpt provides an automated tool to compare the effectiveness of different algorithms across various datasets. For anomaly detection algorithms, it uses the recall and precision metrics to evaluate their performance.
By setting the following options in the configuration file analysis.ini, you can specify the anomaly detection algorithm to be used, the time range of the test data, whether to generate annotated result images, the desired algorithm, and its corresponding parameters.
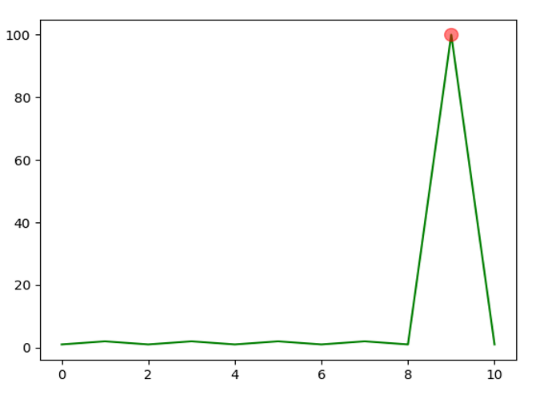
Before comparing anomaly detection algorithms, you must manually label the results of the anomaly detection dataset. This is done by setting the value of the [anno_res] option. Each number in the array represents the index of an anomaly. For example, in the test dataset below, if the 9th point is an anomaly, the labeled result would be [9].
[ad]
# training data start time
start_time = 2021-01-01T01:01:01

# training data end time
end_time = 2021-01-01T01:01:11

# draw the results or not
gen_figure = true

# annotate the anomaly_detection result
anno_res = [9]

# algorithms list that is involved in the comparison
[ad.algos]
ksigma={"k": 2}
iqr={}
grubbs={}
lof={"algorithm":"auto", "n_neighbor": 3}
After the comparison program finishes running, it automatically generates a file named ad_result.xlsx. The first sheet contains the algorithm execution results (as shown in the table below), including five metrics: algorithm name, execution parameters, recall, precision, and execution time.
| algorithm | params | precision(%) | recall(%) | elapsed_time(ms.) |
|---|---|---|---|---|
| ksigma | {"k":2} | 100 | 100 | 0.453 |
| iqr | {} | 100 | 100 | 2.727 |
| grubbs | {} | 100 | 100 | 2.811 |
| lof | {"algorithm":"auto", "n_neighbor":3} | 0 | 0 | 4.660 |
If gen_figure is set to true, the tool automatically generates a visual representation of the analysis results for each algorithm being compared. The k-sigma algorithm is shown here as an example.
