The TDengine Data Model
To clearly explain the concepts of time-series data and facilitate the writing of example programs, the TDengine documentation uses smart meters as an example. These example smart meters can collect three metrics: current, voltage, and phase. In addition, each smart meter also has two static attributes: location and group ID. The data collected by these smart meters is shown in the table below.
| Device ID | Timestamp | Current | Voltage | Phase | Location | Group ID |
|---|---|---|---|---|---|---|
| d1001 | 1538548685000 | 10.3 | 219 | 0.31 | California.SanFrancisco | 2 |
| d1002 | 1538548684000 | 10.2 | 220 | 0.23 | California.SanFrancisco | 3 |
| d1003 | 1538548686500 | 11.5 | 221 | 0.35 | California.LosAngeles | 3 |
| d1004 | 1538548685500 | 13.4 | 223 | 0.29 | California.LosAngeles | 2 |
| d1001 | 1538548695000 | 12.6 | 218 | 0.33 | California.SanFrancisco | 2 |
| d1004 | 1538548696600 | 11.8 | 221 | 0.28 | California.LosAngeles | 2 |
| d1002 | 1538548696650 | 10.3 | 218 | 0.25 | California.SanFrancisco | 3 |
| d1001 | 1538548696800 | 12.3 | 221 | 0.31 | California.SanFrancisco | 2 |
These smart meters collect data based on external trigger events or preset periods, ensuring the continuity and temporality of the data, thus forming a continuously updated data stream.
Basic Concepts
Metric
A metric refers to a physical quantity, such as current, voltage, or temperature, obtained from a sensor, device, or other data collection point. Since these physical quantities change over time, the types of data collected are diverse, including integers, floating-point numbers, and strings. As time passes, the stored data will continue to grow. For example, in smart meters, current, voltage, and phase are typical metrics collected.
Tag
A tag refers to a static attribute associated with a sensor, device, or other data collection point. These are attributes that do not change over time, such as device model, color, or location. The data type of tags can be any type. Although tags themselves are static, in practical applications, you may need to modify, delete, or add tags. Unlike quantities collected, the amount of tag data stored remains relatively stable over time and does not show a significant growth trend. In the example of smart meters, location and group ID are typical tags.
Data Collection Point
A data collection point (DCP) refers to a hardware or software device responsible for collecting metrics at a certain preset time period or when triggered by specific events. A data collection point can collect one or more quantities at the same time, but these quantities are obtained at the same moment and have the same timestamp. Complex structured devices typically include multiple data collection points, each with different collection cycles, and they operate independently without interference. For example, a car might have a dedicated data collection point for collecting location information, some for monitoring engine status, and others focused on monitoring the interior environment. Thus, a car could contain three different types of data collection points. In the example of smart meters, identifiers such as d1001, d1002, and d1003 represent different data collection points.
Table
Given that the time-series data collected from DCPs is usually structured, TDengine uses the traditional relational database model to manage data. At the same time, to fully utilize the characteristics of time-series data, TDengine adopts a "one table per device" design, requiring a separate table for each data collection point. For example, if there are millions of smart meters, a corresponding number of tables need to be created in TDengine. In the example data of smart meters, the smart meter with device ID d1001 corresponds to a table in TDengine, and all the time-series data collected by this meter is stored in this table. This design approach retains the usability of relational databases while fully utilizing the unique advantages of time-series data:
-
Since the data generation process at different data collection points is completely independent, and each data collection point has a unique data source, there is only one writer per table. This allows for lock-free data writing, significantly increasing the write speed.
-
For a data collection point, the data it generates is in chronological order, so the write operation can be implemented in an append-only manner, further greatly enhancing the data writing speed.
-
The data from a data collection point is stored continuously in blocks. Thus, reading data from a specific time period can significantly reduce random read operations, dramatically improving the speed of data reading and querying.
-
Within a data block, columnar storage is used, and different compression algorithms can be applied to different data types to improve the compression ratio. Moreover, since the rate of data collection changes is usually slow, the compression ratio will be higher.
If the traditional method of writing data from multiple data collection points into a single table is used, due to uncontrollable network latency, the sequence of data arrival at the server from different data collection points cannot be guaranteed, and the write operation needs to be protected by locks. Moreover, it is difficult to ensure that the data from one data collection point is stored continuously together. Using the method of one data collection point per table can ensure to the greatest extent that the performance of insertion and querying for a single data collection point is optimal, and the data compression ratio is the highest.
In TDengine, the name of the data collection point (e.g., d1001) is usually used as the table name, and each data collection point can have multiple metrics (such as current, voltage, phase, etc.), each corresponding to a column in a table. The data type of the metrics can be integer, floating-point, string, etc.
Additionally, the first column of the table must be a timestamp. For each metric, TDengine will use the first column timestamp to build an index and use columnar storage. For complex devices, such as cars, which have multiple data collection points, multiple tables need to be created for one car.
Supertable
Although the "one table per device" design helps to manage each collection point specifically, as the number of devices increases, the number of tables also increases dramatically, posing challenges for database management and data analysis. When performing aggregation operations across data collection points, users need to deal with a large number of tables, making the work exceptionally cumbersome.
To solve this problem, TDengine introduces the supertable. A supertable is a data structure that can aggregate certain types of data collection points together into a logically unified table. These data collection points have the same table structure, but their static properties (such as tags) may differ. When creating a supertable, in addition to defining the metrics, it is also necessary to define the tags of the supertable. A supertable must contain at least one timestamp column, one or more metric columns, and one or more tag columns. Moreover, the tags of the supertable can be flexibly added, modified, or deleted.
In TDengine, a table represents a specific data collection point, while a supertable represents a collection of data collection points with the same attributes. Taking smart meters as an example, we can create a supertable for this type of meter, which includes all the common properties and metrics of smart meters. This design not only simplifies table management but also facilitates aggregation operations across data collection points, thereby improving the efficiency of data processing.
Subtable
A subtable is a logical abstraction of a data collection point and is a specific table belonging to a supertable. You can use the definition of the supertable as a template and create subtables by specifying the tag values of the subtables. Thus, tables generated through the supertable are referred to as subtables. The relationship between the supertable and subtables is mainly reflected in the following aspects.
- A supertable contains multiple subtables, which have the same table structure but different tag values.
- The table structure of subtables cannot be directly modified, but the columns and tags of the supertable can be modified, and the modifications take effect immediately for all subtables.
- A supertable defines a template and does not store any data or tag information itself.
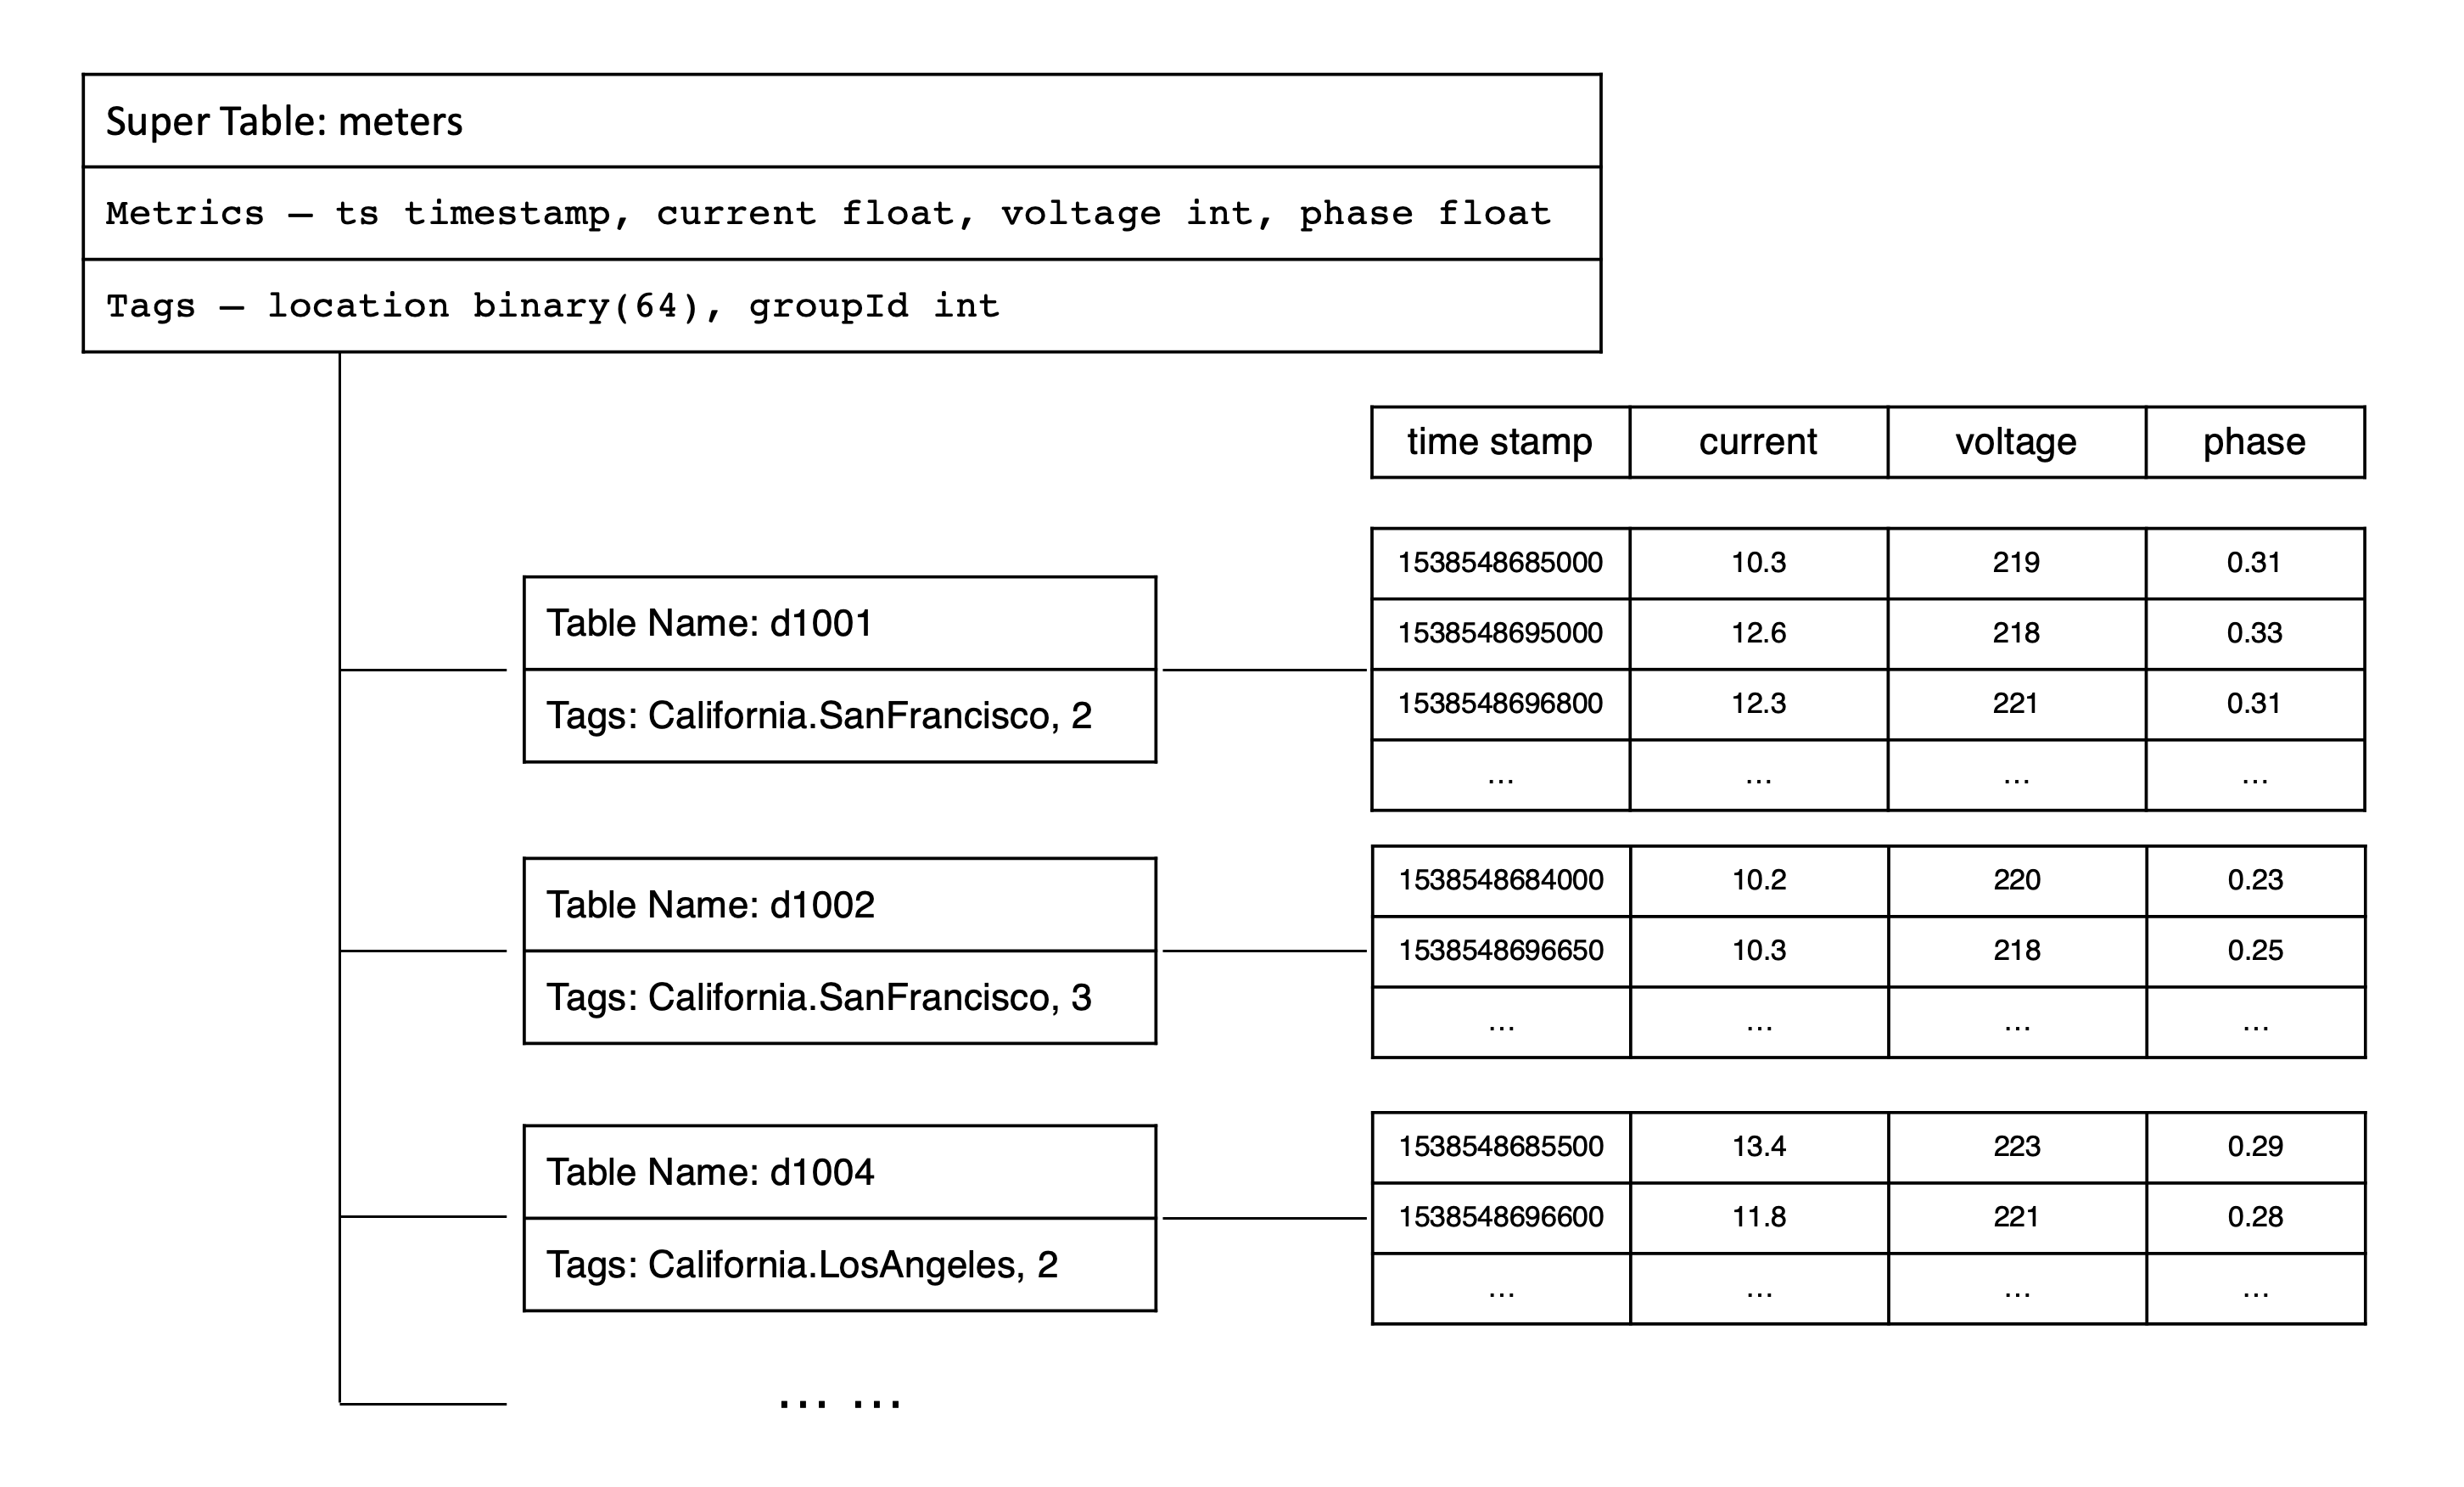
In TDengine, query operations can be performed on both subtables and supertables. For queries on supertables, TDengine treats the data from all subtables as a whole, first filtering out the tables that meet the query conditions through tags, then querying the time-series data on these subtables separately, and finally merging the query results from each subtable. Essentially, by supporting queries on supertables, TDengine achieves efficient aggregation of multiple similar data collection points. To better understand the relationship between metrics, tags, supertables, and subtables, here is an example of a data model for smart meters. You can refer to the data model diagram below for a more intuitive understanding of these concepts.
To better understand the relationship between metrics, tags, supertables, and subtables, taking smart meters as an example, refer to the following diagram.
Virtual Tables
The design of "one table per data collection point" and "supertables" addresses most challenges in time-series data management and analysis for industrial and IoT scenarios. However, in real-world scenarios, a single device often has multiple sensors with varying collection frequencies. For example, a wind turbine may have electrical parameters, environmental parameters, and mechanical parameters, each collected by different sensors at different intervals. This makes it difficult to describe a device with a single table, often requiring multiple tables. When analyzing data across multiple sensors, multi-level join queries become necessary, which can lead to usability and performance issues. From a user perspective, "one table per device" is more intuitive. However, directly implementing this model would result in excessive NULL values at each timestamp due to varying collection frequencies, reducing storage and query efficiency.
To resolve this, TDengine introduces Virtual Tables (VTables). A virtual table is a logical entity that does not store physical data but enables analytical computations by dynamically combining columns from multiple source tables (subtables or regular tables). Like physical tables, virtual tables can be categorized into virtual supertables, virtual subtables, and virtual regular tables. A virtual supertable can represent a complete dataset for a device or group of devices, while each virtual subtable can flexibly reference columns from different sources. This allows users to define custom data views tailored to specific analytical needs, achieving a "personalized schema per user" effect. Virtual tables cannot be written to or deleted from but are queried like physical tables. The key distinction is that virtual table data is dynamically generated during queries; only columns referenced in a query are merged into the virtual table. Thus, the same virtual table may present entirely different datasets across different queries.
Key Features of Virtual Supertables
- Column Selection & Merging: Users can select specific columns from multiple source tables and combine them into a unified view.
- Timestamp-Based Alignment: Data is aligned by timestamp. If multiple tables have data at the same timestamp, their column values are merged into a single row. Missing values are filled with NULL.
- Dynamic Updates: Virtual tables automatically reflect changes in source tables, ensuring real-time data without physical storage.
By introducing virtual tables, TDengine simplifies the management of complex device data. Regardless of how individual collection points are modeled (single-column or multi-column) or distributed across databases/tables, users can freely define data sources through virtual supertables. This enables cross-collection-point aggregation and analysis, making "one table per device" a practical reality.
Database
A database in TDengine is used to manage a collection of tables. TDengine allows a running instance to contain multiple databases, and each database can be configured with different storage strategies. Since different types of data collection points usually have different data characteristics, such as data collection frequency, data retention period, number of replicas, data block size, etc., it is recommended to create supertables with different data characteristics in different databases.
In a database, one to many supertables can be included, but each supertable can only belong to one database. At the same time, all subtables owned by a supertable are also stored in that database. This design helps to achieve more fine-grained data management and optimization, ensuring that TDengine can provide the best processing performance based on different data characteristics.
Timestamps
Timestamps play a crucial role in time-series data processing, especially when applications need to access the database from multiple time zones, making the issue more complex. Before delving into how TDengine handles timestamps and time zones, let's first introduce a few basic concepts.
- Local date and time: Refers to the local time of a specific region, usually expressed as a string in the format yyyy-MM-dd hh:mm:ss.SSS. This representation of time does not include any time zone information, such as "2021-07-21 12:00:00.000".
- Time zone: Standard time in different geographical locations on Earth. Coordinated Universal Time (UTC) or Greenwich Mean Time is the international time standard, and other time zones are usually expressed as an offset from UTC, such as "UTC+8" representing East Eight Zone time. UTC timestamp: Represents the number of milliseconds since the UNIX epoch (i.e., UTC time January 1, 1970, at 0:00). For example, "1700000000000" corresponds to the date and time "2023-11-14 22:13:20 (UTC+0)". In TDengine, when saving time-series data, what is actually saved is the UTC timestamp. When writing data, TDengine handles timestamps in the following two ways.
- RFC-3339 format: When using this format, TDengine can correctly parse time strings with time zone information into UTC timestamps. For example, "2018-10-03T14:38:05.000+08:00" will be converted into a UTC timestamp.
- Non-RFC-3339 format: If the time string does not contain time zone information, TDengine will use the time zone setting of the application to automatically convert the time into a UTC timestamp.
When querying data, the TDengine client will automatically convert the saved UTC timestamps into local time according to the current time zone setting of the application, ensuring that users in different time zones can see the correct time information.
Data Modeling
This section uses smart meters as an example to briefly introduce how to use SQL to create databases, supertables, and basic table operations in TDengine.
Creating a Database
The SQL to create a database for storing meter data is as follows:
CREATE DATABASE power PRECISION 'ms' KEEP 3650 DURATION 10 BUFFER 16;
This SQL will create a database named power, with the following parameters explained:
PRECISION 'ms': This database uses millisecond (ms) precision timestamps for its time-series dataKEEP 3650: The data in this database will be retained for 3650 days, and data older than 3650 days will be automatically deletedDURATION 10: Data for every 10 days is stored in one data fileBUFFER 16: Writing uses a memory pool of size 16MB.
After creating the power database, you can execute the USE statement to switch databases.
use power;
This SQL switches the current database to power, indicating that subsequent insertions, queries, and other operations will be performed in the current power database.
Creating a Supertable
The SQL to create a supertable named meters is as follows:
CREATE STABLE meters (
    ts timestamp,
    current float,
    voltage int,
    phase float
) TAGS (
    location varchar(64),
    group_id int
);
In TDengine, the SQL statement to create a supertable is similar to that in relational databases. For example, in the SQL above, CREATE STABLE is the keyword, indicating the creation of a supertable; then, meters is the name of the supertable; in the parentheses following the table name, the columns of the supertable are defined (column names, data types, etc.), with the following rules:
- The first column must be a timestamp column. For example:
ts timestampindicates that the timestamp column name ists, and its data type istimestamp; - Starting from the second column are the measurement columns. The data types of measurements can be integer, float, string, etc. For example:
current floatindicates that the measurement currentcurrent, data type isfloat;
Finally, TAGS is a keyword, indicating tags, and in the parentheses following TAGS, the tags of the supertable are defined (tag names, data types, etc.).
- The data type of tags can be integer, float, string, etc. For example:
location varchar(64)indicates that the tag regionlocation, data type isvarchar(64); - The names of tags cannot be the same as the names of measurement columns.
Creating a Table
The SQL to create a subtable d1001 using the supertable is as follows:
CREATE TABLE d1001
USING meters (
    location,
    group_id
) TAGS (
    "California.SanFrancisco",
    2
);
In the SQL above, CREATE TABLE is a keyword indicating the creation of a table; d1001 is the name of the subtable; USING is a keyword indicating the use of a supertable as a template; meters is the name of the supertable; in the parentheses following the supertable name, location, group_id are the names of the tag columns of the supertable; TAGS is a keyword, and the values of the tag columns for the subtable are specified in the following parentheses. "California.SanFrancisco" and 2 indicate that the location of subtable d1001 is California.SanFrancisco, and the group ID is 2.
When performing write or query operations on a supertable, users can use the pseudocolumn tbname to specify or output the name of the corresponding subtable.
Automatic Table Creation
In TDengine, to simplify user operations and ensure smooth data entry, even if a subtable does not exist, users can use the automatic table creation SQL with the using keyword to write data. This mechanism allows the system to automatically create the subtable when it encounters a non-existent subtable, and then perform the data writing operation. If the subtable already exists, the system will write the data directly without any additional steps.
The SQL for writing data while automatically creating tables is as follows:
INSERT INTO d1002
USING meters
TAGS (
    "California.SanFrancisco",
    2
) VALUES (
    NOW,
    10.2,
    219,
    0.32
);
In the SQL above, INSERT INTO d1002 indicates writing data into the subtable d1002; USING meters indicates using the supertable meters as a template; TAGS ("California.SanFrancisco", 2) indicates the tag values for subtable d1002 are California.SanFrancisco and 2; VALUES (NOW, 10.2, 219, 0.32) indicates inserting a record into subtable d1002 with values NOW (current timestamp), 10.2 (current), 219 (voltage), 0.32 (phase). When TDengine executes this SQL, if subtable d1002 already exists, it writes the data directly; if subtable d1002 does not exist, it first automatically creates the subtable, then writes the data.
Creating Basic Tables
In TDengine, apart from subtables with tags, there are also basic tables without any tags. These tables are similar to tables in traditional relational databases, and users can create them using SQL.
The differences between basic tables and subtables are:
- Tag Extensibility: Subtables add static tags on top of basic tables, allowing them to carry more metadata. Additionally, the tags of subtables are mutable, and users can add, delete, or modify tags as needed.
- Table Ownership: Subtables always belong to a supertable and are part of it. Basic tables, however, exist independently and do not belong to any supertable.
- Conversion Restrictions: In TDengine, basic tables cannot be directly converted into subtables, and likewise, subtables cannot be converted into basic tables. These two types of tables determine their structure and properties at creation and cannot be changed later.
In summary, basic tables provide functionality similar to traditional relational database tables, while subtables introduce a tagging mechanism, offering richer descriptions and more flexible management for time-series data. Users can choose to create basic tables or subtables based on actual needs.
The SQL for creating an basic table without any tags is as follows:
CREATE TABLE d1003(
    ts timestamp,
    current float,
    voltage int,
    phase float,
    location varchar(64),
    group_id int
);
The SQL above indicates the creation of the basic table d1003, with a structure including columns ts, current, voltage, phase, location, group_id, totaling 6 columns. This data model is completely consistent with relational databases.
Using basic tables as the data model means that static tag data (such as location and group_id) will be repeatedly stored in each row of the table. This approach not only increases storage space consumption but also significantly lowers query performance compared to using a supertable data model, as it cannot directly utilize tag data for filtering.
Multi-Column Model vs. Single-Column Model
TDengine supports flexible data model designs, including multi-column and single-column models. The multi-column model allows multiple physical quantities collected simultaneously from the same data collection point with the same timestamp to be stored in different columns of the same supertable. However, in some extreme cases, a single-column model might be used, where each collected physical quantity is established in a separate table. For example, for the three physical quantities of current, voltage, and phase, three separate supertables might be established.
Although TDengine recommends using the multi-column model because it generally offers better writing and storage efficiency, the single-column model might be more suitable in certain specific scenarios. For example, if the types of quantities collected at a data collection point frequently change, using a multi-column model would require frequent modifications to the supertable's structural definition, increasing the complexity of the application. In such cases, using a single-column model can simplify the design and management of the application, as it allows independent management and expansion of each physical quantity's supertable.
Overall, TDengine offers flexible data model options, allowing users to choose the most suitable model based on actual needs and scenarios to optimize performance and manage complexity.
Creating Virtual Tables
Whether using single-column or multi-column models, TDengine enables cross-table operations through virtual tables. Using smart meters as an example, here we introduce two typical use cases for virtual tables:
- Single-Source Multi-Dimensional Time-Series Aggregation
- Cross-Source Metric Comparative Analysis
1. Single-Source Multi-Dimensional Time-Series Aggregation
In this scenario, "single-source" refers to multiple single-column time-series tables from the same data collection point. While these tables are physically split due to business requirements or constraints, they maintain logical consistency through device tags and timestamps. Virtual tables restore "vertically" split data into a complete "horizontal" view of the collection point. For example, Suppose three supertables are created for current, voltage, and phase measurements using a single-column model. Virtual tables can aggregate these three measurements into one unified view.
The SQL statement for creating a supertable in the single-column model is as follows:
CREATE STABLE current_stb (
    ts timestamp,
    current float
) TAGS (
    device_id varchar(64),
    location varchar(64),
    group_id int
);

CREATE STABLE voltage_stb (
    ts timestamp,
    voltage int
) TAGS (
    device_id varchar(64),
    location varchar(64),
    group_id int
);

CREATE STABLE phase_stb (
    ts timestamp,
    phase float
) TAGS (
    device_id varchar(64),
    location varchar(64),
    group_id int
);
Assume there are four devices: d1001, d1002, d1003, and d1004. To create subtables for their current, voltage, and phase measurements, use the following SQL statements:
create table current_d1001 using current_stb(device_id, location, group_id) tags("d1001", "California.SanFrancisco", 2);
create table current_d1002 using current_stb(device_id, location, group_id) tags("d1002", "California.SanFrancisco", 3);
create table current_d1003 using current_stb(device_id, location, group_id) tags("d1003", "California.LosAngeles", 3);
create table current_d1004 using current_stb(device_id, location, group_id) tags("d1004", "California.LosAngeles", 2);

create table voltage_d1001 using voltage_stb(device_id, location, group_id) tags("d1001", "California.SanFrancisco", 2);
create table voltage_d1002 using voltage_stb(device_id, location, group_id) tags("d1002", "California.SanFrancisco", 3);
create table voltage_d1003 using voltage_stb(device_id, location, group_id) tags("d1003", "California.LosAngeles", 3);
create table voltage_d1004 using voltage_stb(device_id, location, group_id) tags("d1004", "California.LosAngeles", 2);

create table phase_d1001 using phase_stb(device_id, location, group_id) tags("d1001", "California.SanFrancisco", 2);
create table phase_d1002 using phase_stb(device_id, location, group_id) tags("d1002", "California.SanFrancisco", 3);
create table phase_d1003 using phase_stb(device_id, location, group_id) tags("d1003", "California.LosAngeles", 3);
create table phase_d1004 using phase_stb(device_id, location, group_id) tags("d1004", "California.LosAngeles", 2);
A virtual supertable can be used to aggregate these three types of measurements into a single table. The SQL statement to create the virtual supertable is as follows:
CREATE STABLE meters_v (
    ts timestamp,
    current float,
    voltage int,
    phase float
) TAGS (
    location varchar(64),
    group_id int
) VIRTUAL 1;
For the four devices d1001, d1002, d1003, and d1004, create virtual subtables with the following SQL statements:
CREATE VTABLE d1001_v (
    current from current_d1001.current,
    voltage from voltage_d1001.voltage,
    phase from phase_d1001.phase
)
USING meters_v
TAGS (
    "California.SanFrancisco",
    2
);

CREATE VTABLE d1002_v (
    current from current_d1002.current,
    voltage from voltage_d1002.voltage,
    phase from phase_d1002.phase
)
USING meters_v
TAGS (
    "California.SanFrancisco",
    3
);

CREATE VTABLE d1003_v (
    current from current_d1003.current,
    voltage from voltage_d1003.voltage,
    phase from phase_d1003.phase
)
USING meters_v
TAGS (
    "California.LosAngeles",
    3
);

CREATE VTABLE d1004_v (
    current from current_d1004.current,
    voltage from voltage_d1004.voltage,
    phase from phase_d1004.phase
)
USING meters_v
TAGS (
    "California.LosAngeles",
    2
);
Taking device d1001 as an example, assume that the current, voltage, and phase data of device d1001 are as follows:
| current_d1001 | voltage_d1001 | phase_d1001 | |||||
|---|---|---|---|---|---|---|---|
| Timestamp | Current | Timestamp | Voltage | Timestamp | Phase | ||
| 1538548685000 | 10.3 | 1538548685000 | 219 | 1538548685000 | 0.31 | ||
| 1538548695000 | 12.6 | 1538548695000 | 218 | 1538548695000 | 0.33 | ||
| 1538548696800 | 12.3 | 1538548696800 | 221 | 1538548696800 | 0.31 | ||
| 1538548697100 | 12.1 | 1538548697100 | 220 | 1538548697200 | 0.32 | ||
| 1538548697700 | 11.8 | 1538548697800 | 222 | 1538548697800 | 0.33 | ||
| Timestamp | Current | Voltage | Phase |
|---|---|---|---|
| 1538548685000 | 10.3 | 219 | 0.31 |
| 1538548695000 | 12.6 | 218 | 0.33 |
| 1538548696800 | 12.3 | 221 | 0.31 |
| 1538548697100 | 12.1 | 220 | NULL |
| 1538548697200 | NULL | NULL | 0.32 |
| 1538548697700 | 11.8 | NULL | NULL |
| 1538548697800 | NULL | 222 | 0.33 |
2. Cross-Source Metric Comparative Analysis
In this scenario, "cross-source" refers to data from different data collection points. Virtual tables align and merge semantically comparable measurements from multiple devices for comparative analysis.
For example, Compare current measurements across devices d1001, d1002, d1003, and d1004. The SQL statement to create the virtual table is as follows:
CREATE VTABLE current_v (
    ts TIMESTAMP,
    d1001_current FLOAT FROM current_d1001.current,
    d1002_current FLOAT FROM current_d1002.current,
    d1003_current FLOAT FROM current_d1003.current,
    d1004_current FLOAT FROM current_d1004.current
);
Assume that the current data of devices d1001, d1002, d1003, and d1004 are as follows:
| d1001 | d1002 | d1003 | d1004 | |||||||
|---|---|---|---|---|---|---|---|---|---|---|
| Timestamp | Current | Timestamp | Current | Timestamp | Current | Timestamp | Current | |||
| 1538548685000 | 10.3 | 1538548685000 | 11.7 | 1538548685000 | 11.2 | 1538548685000 | 12.4 | |||
| 1538548695000 | 12.6 | 1538548695000 | 11.9 | 1538548695000 | 10.8 | 1538548695000 | 11.3 | |||
| 1538548696800 | 12.3 | 1538548696800 | 12.4 | 1538548696800 | 12.3 | 1538548696800 | 10.1 | |||
| 1538548697100 | 12.1 | 1538548697200 | 12.2 | 1538548697100 | 11.1 | 1538548697200 | 11.7 | |||
| 1538548697700 | 11.8 | 1538548697700 | 11.4 | 1538548697800 | 12.1 | 1538548697800 | 12.6 | |||
The virtual table current_v aligns current data by timestamp:
| Timestamp | d1001_current | d1002_current | d1003_current | d1004_current |
|---|---|---|---|---|
| 1538548685000 | 10.3 | 11.7 | 11.2 | 12.4 |
| 1538548695000 | 12.6 | 11.9 | 10.8 | 11.3 |
| 1538548696800 | 12.3 | 12.4 | 12.3 | 10.1 |
| 1538548697100 | 12.1 | NULL | 11.1 | NULL |
| 1538548697200 | NULL | 12.2 | NULL | 11.7 |
| 1538548697700 | 11.8 | 11.4 | NULL | NULL |
| 1538548697800 | NULL | NULL | 12.1 | 12.6 |