Grafana Integration
Grafana is a popular open-source visualization and monitoring platform. TDengine integrates with Grafana through a data source plugin so you can build charts, dashboards, and alerts without writing application code.
This chapter uses the test database meter data written by taosBenchmark -y in the quick start. You will complete a minimal integration: confirm data, install the TDengine Grafana plugin, configure a data source, and create a panel that shows average current over time.
Prerequisites
Confirm the following:
- The TDengine service is running.
- taosAdapter is running and Grafana can reach its WebSocket/REST port (default
6041). - Grafana is installed and running. TDengine supports Grafana 8.0 and later.
- You have run
taosBenchmark -yin the Download and Install quick start so thetestdatabase andmeterssupertable exist. If not, runtaosBenchmark -yin a terminal first.
If you started TDengine with the Docker option in this quick start, port 6041 is already mapped and you can use http://localhost:6041 as the TDengine data source URL.
To generate fresher sample data for Grafana’s default “Last 1 hour” range instead of the historical 2017-07-14 timestamps from taosBenchmark -y, you can also run:
taosBenchmark --start-timestamp=$(date --date="1 hours ago" +%s%3N) \
  --time-step=1000 --records=1000 \
  --tables=100 --answer-yes
This creates a meters supertable in the test database with 100 subtables and 1,000 records each, starting from one hour ago.
Prepare Sample Data
In the shell, confirm that test.meters already has data.
USE test;

SELECT tbname, ts, current, voltage
FROM meters
WHERE voltage > 250 and tbname = 'd1'
ORDER BY ts DESC
LIMIT 5;
The result looks similar to the following.
 tbname |           ts            | current  | voltage |
========================================================
 d1     | 2017-07-14 10:40:09.998 |  11.7984 |     253 |
 d1     | 2017-07-14 10:40:09.998 |  11.7984 |     253 |
 d1     | 2017-07-14 10:40:09.998 |  11.7984 |     253 |
 d1     | 2017-07-14 10:40:09.998 |  11.7984 |     253 |
 d1     | 2017-07-14 10:40:09.998 |  11.7984 |     253 |

Query OK, 5 row(s) in set
For data written by taosBenchmark -y, timestamps fall between 2017-07-14 10:40:00.000 and 2017-07-14 10:40:09.999. In Grafana, set an absolute time range that covers this interval instead of the default “Last 1 hour”.
Install the Grafana Plugin
Grafana talks to TDengine through the TDengine Datasource plugin. On Linux, run the following install script on the Grafana host:
bash -c "$(curl -fsSL https://raw.githubusercontent.com/taosdata/grafanaplugin/master/install.sh)"
For other platforms, see the plugin installation guide.
After installation, restart Grafana:
sudo systemctl restart grafana-server.service
If you run Grafana in Docker or need a manual install, see the Grafana integration document linked at the end of this page.
Configure the TDengine Data Source
Open Grafana in a browser.
http://localhost:3000
On first login, the default username and password are usually admin / admin. Then add a TDengine data source:
- Go to Connections > Add new connection.
- Search for
TDengineand select the TDengine data source plugin. - Click Add new data source.
- Fill in the connection settings on the configuration page.
Common settings:
- TDengine Host:
http://localhost:6041. For a remote TDengine host, use that address and port. - TDengine Authentication: Database username and password (default
root/taosdata).
Click Save & test. If you see TDengine Data source is working, Grafana can reach TDengine.
Create a Dashboard
After the data source is configured, create a panel that shows average current over time.
- Click Build a dashboard, or go to Dashboards > New / New dashboard.
- Click Add visualization or Add a new panel.
- Select the TDengine data source you configured.
- In the Input SQL field, enter the following query.
SELECT _wstart AS time, AVG(current) AS avg_current
FROM test.meters
WHERE groupId = 1 AND ts >= $from AND ts < $to
INTERVAL($interval)
FILL(NULL);
Where:
$fromand$toare the start and end of the current Grafana time range.$intervalis the window size Grafana derives from the time range.INTERVAL($interval)aggregates points using that window size.- In the quick-start sample data, the grouping tag column is
groupId.
Before clicking Run query or Apply, set an absolute time range in the upper-right corner of Grafana when using taosBenchmark -y data, for example:
- From:
2017-07-14 10:40:00 - To:
2017-07-14 10:40:10
Then run the query. Grafana shows how average current changes over that period.
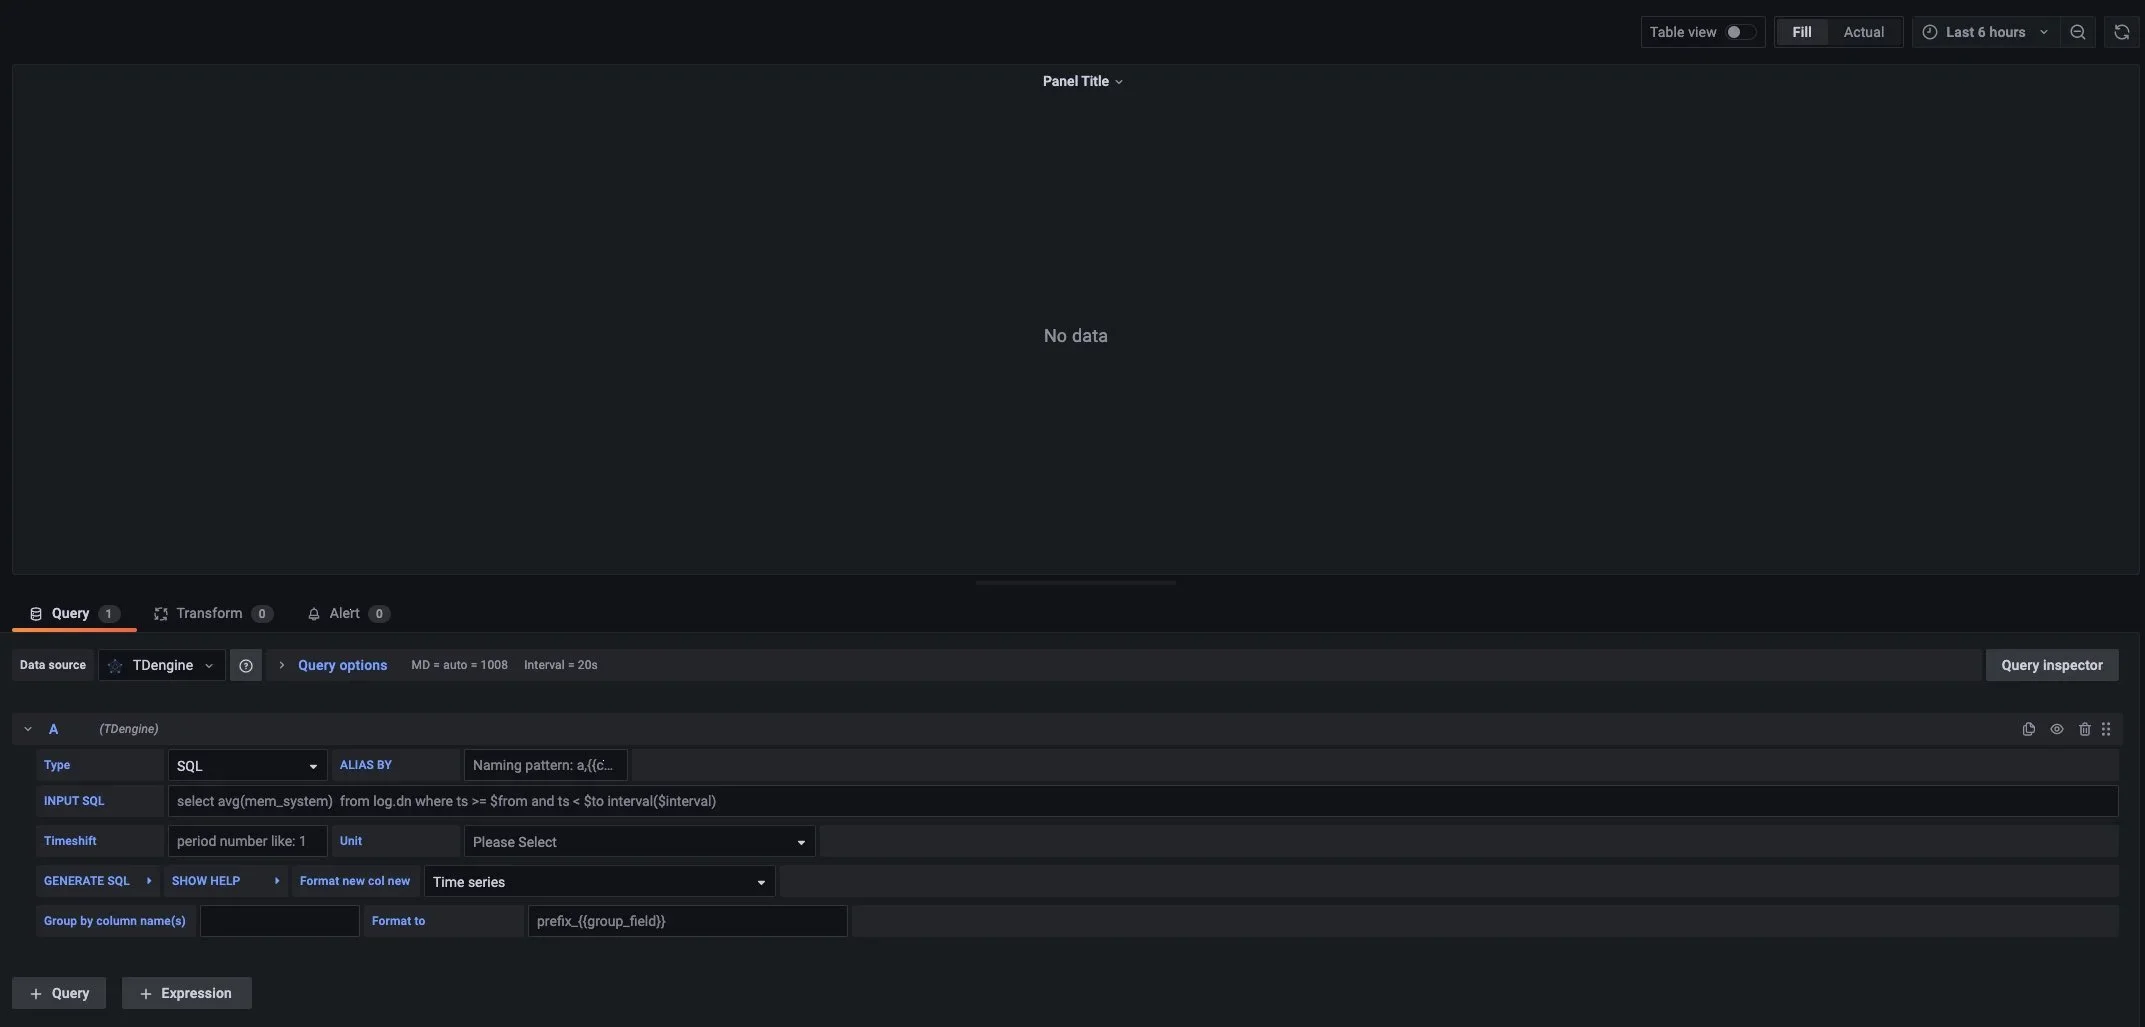
If the chart is empty, confirm the time range covers your sample data and that test.meters contains the quick-start writes.
For more details, see Grafana.
Troubleshooting
If Save & test fails, check the following:
- Whether taosAdapter is running.
- Whether the Grafana host can reach
http://localhost:6041. If Grafana is not on the same machine as TDengine, do not uselocalhost; use the TDengine server address. - Whether the username and password are correct (default
root/taosdata). - Whether Docker, cloud security groups, or firewalls allow port
6041.
If the dashboard has no data, check the following:
- Whether the Grafana time range covers your sample timestamps (for
taosBenchmark -y,2017-07-14 10:40:00to2017-07-14 10:40:10). - Whether the database, supertable, and tag column in SQL match the data (tag column
groupId). - Whether
groupId = 1matches any rows; you can remove that filter to verify the overall series.
Next Steps
This chapter covers only a minimal Grafana integration. For plugin install options, variables, dashboard tips, and performance guidance, continue with:
- Integrate with Grafana: Full plugin install, data source setup, and dashboard guide.
- taosAdapter Reference: WebSocket/REST ports and configuration.
- Data Querying:
INTERVAL,FILL,GROUP BY, and time-range queries. - Visual Management: Query and manage data in Explorer.