TDengine Query Performance Testing with JMeter
Background
In Internet of Things (IoT) and industrial monitoring scenarios, the query performance of a Time Series Database is critical. As a high-performance time-series database, TDengine's query performance directly impacts real-time monitoring, data analysis, and decision-making efficiency.
This document addresses the following issues:
- How to test TDengine query performance using a standard tool (JMeter).
- How to simulate real business scenarios for stress testing.
- How to analyze test results and optimize database configuration.
Target Audience: Developers, test engineers, and IT Operations. This document assumes readers have basic database knowledge but do not require an in-depth understanding of JMeter or TDengine.
Note: This document does not cover TDengine write performance testing or query performance tuning.
Environment Preparation
Environment List & Driver Download
Required Environment:
- JDK 8+ + JMeter 5.6.3:
- Recommended JDK: JDK 8 or later (JDK 8/11/17/21 supported)
- JMeter 5.6.3 Download: https://jmeter.apache.org/download_jmeter.cgi
Note: JMeter 5.6.3 supports Java 8 and above.
- TDengine JDBC Driver: Download latest dist package from Maven Repository
- TDengine Server: Official Installation Docs
- taosgen Tool (built into TDengine, for test data generation): taosgen User Guide
Verified Environment for This Document:
- JDK Version: JDK 11 (performance verification)
- JMeter Version: 5.6.3
- TDengine Version: 3.4.0.4.enterprise
- TDengine JDBC Driver: 3.8.1
JDBC Driver Configuration
After downloading the TDengine JDBC Driver dist package, two configuration methods are available:
-
Method 1: Place into JMeter
lib/extdirectory (recommended)# JMETER_HOME = JMeter install dir, e.g. /opt/apache-jmeter-5.6.3/
cp taos-jdbcdriver-3.8.1-dist.jar $JMETER_HOME/lib/ext/ -
Method 2: Specify Classpath in JMX file (not recommended, fallback only)
Configure in the TestPlan element:
<stringProp name="TestPlan.user_define_classpath">/absolute/path/to/taos-jdbcdriver-3.8.1-dist.jar</stringProp>
Note: Method 1 is strongly recommended for CLI mode.
JDBC Connection Method
- Connection Method: WebSocket
- Driver Class:
com.taosdata.jdbc.ws.WebSocketDriver - URL Format:
jdbc:TAOS-WS://host1:port1,host2:port2,host3:port3/database?params - Default Port: 6041
- Features:
- ✅ No TDengine client driver required
- ✅ Multi-endpoint supported (comma-separated, connection-level load balancing)
- ✅ Auto-reconnection & failover
- ✅ Good cross-platform compatibility
Note: Multi-endpoint selects a node via the minimum connection count algorithm at connection setup. A single JDBC connection binds to one node for its lifetime — not request-level load balancing.
URL Examples:
# Single endpoint (test env)
jdbc:TAOS-WS://127.0.0.1:6041/test?user=root&password=taosdata&timezone=Asia/Shanghai

# Three endpoints (production, recommended) ⭐
jdbc:TAOS-WS://192.168.1.100:6041,192.168.1.101:6041,192.168.1.102:6041/test?user=root&password=taosdata&timezone=Asia/Shanghai
Performance Test Environment Checklist
Verify these system settings before performance testing to avoid bottlenecks:
| Check Item | Recommended Value | Command |
|---|---|---|
| File handle limit | 65535 | ulimit -n |
| TCP connection optimization | Adjust by concurrency | sysctl net.ipv4.tcp_max_tw_buckets |
| Swap status | Disabled | swapon --show or free -h |
| Swappiness value | 1–10 (server) | sysctl vm.swappiness |
Note: See your OS official docs for system tuning. For TDengine server config, refer to taosd Configuration.
Test Data Preparation
Generate Test Data with taosgen
Use taosgen to generate smart meter test data.
Create Configuration File
Sample config taosgen_meters.yaml:
tdengine:
  dsn: taos+ws://root:taosdata@127.0.0.1:6041/test
  drop_if_exists: true
  props: precision 'ms' vgroups 32 cachemodel 'last_row'

schema:
  name: meters
  tbname:
    prefix: d
    count: 1000000
    from: 0
  columns:
    - name: ts
      type: timestamp
      start: 1704067200000  # 2024-01-01
      precision: ms
      step: 60s  # 1-min interval
    - name: current
      type: float
      min: 0
      max: 100
    - name: voltage
      type: int
      expr: '220 * math.sqrt(2) * math.sin(_i)'
    - name: phase
      type: float
      min: 0
      max: 360
  tags:
    - name: location
      type: binary(24)
      values:
        - Beijing
        - Shanghai
        - Guangzhou
        - Shenzhen
        - Chengdu
    - name: group_id
      type: int
      min: 1
      max: 1000000
  generation:
    interlace: 1
    rows_per_table: 100
    rows_per_batch: 10000
    num_cached_batches: 0

jobs:
  insert:
    steps:
      - uses: tdengine/create-super-table
      - uses: tdengine/create-child-table
        with:
          batch:
            size: 100
            concurrency: 10
      - uses: tdengine/insert
        with:
          concurrency: 20
Run Data Generation
# Generate data from config
taosgen -c taosgen_meters.yaml
Data Scale
- Super Table:
meters - Child Tables: 1,000,000 (d0 ~ d999999)
- Rows per Child Table: 100
- Total Rows: 100 million
Note:
rows_per_batch= batch write buffer size, not rows per table. No problem ifrows_per_batch>rows_per_table.- Adjust
countandrows_per_tablefor your needs.
Small-Scale Version
For quick validation:
schema:
  name: meters
  tbname:
    prefix: d
    count: 10000      # 10k child tables
    from: 0
  generation:
    rows_per_table: 100
Total: 10k tables × 100 rows = 1 million rows, good for quick tests.
CACHEMODEL Cache Settings
TDengine caches last_row results, which must be set at database creation and strongly affects test results.
CACHEMODEL Parameter:
| Value | Description | Use Case |
|---|---|---|
none | No cache (default) | Test real disk I/O for last_row |
last_row | Cache last row per child table | Speed up LAST_ROW queries |
last_value | Cache last non-NULL value per column | Speed up LAST function |
both | Both caches enabled | Max cache effect |
How to Configure:
-- Create DB with cache (recommended)
CREATE DATABASE test CACHEMODEL 'last_row';

-- Alter existing DB
ALTER DATABASE test CACHEMODEL 'last_row';

-- Show current config
show create database test;
Notes:
- Default =
none(cache off) - Frequent
CACHEMODELchanges may breaklast/last_rowaccuracy - Production: use
last_roworboth - Test behavior:
- Cache on:
last_rowtests connection & scheduling - Cache off:
last_rowtests random disk I/O - Disk I/O test: use range / full-scan queries
- Cache on:
taosgen Example:
tdengine:
  dsn: taos+ws://root:taosdata@127.0.0.1:6041/test
  drop_if_exists: true
  props: precision 'ms' vgroups 32 cachemodel 'last_row'
Minimal Query Test & Result Analysis
JDBC Connection Configuration
JMeter Modes
- GUI Mode: For editing/debugging only — not for performance testing
- CLI Mode (recommended): For performance testing, lightweight & stable
All tests use CLI Mode. Edit in GUI by importing the JMX file.
Sample baseline_test.jmx:
<?xml version="1.0" encoding="UTF-8"?>
<jmeterTestPlan version="1.2" properties="5.0" jmeter="5.6.3">
  <hashTree>
    <TestPlan guiclass="TestPlanGui" testclass="TestPlan" testname="TDengine Baseline Test Plan">
      <stringProp name="TestPlan.comments">Baseline test for TDengine database query performance</stringProp>
      <boolProp name="TestPlan.functional_mode">false</boolProp>
      <boolProp name="TestPlan.tearDown_on_shutdown">true</boolProp>
      <boolProp name="TestPlan.serialize_threadgroups">false</boolProp>
      <elementProp name="TestPlan.user_defined_variables" elementType="Arguments" guiclass="ArgumentsPanel" testclass="Arguments" testname="User Defined Variables">
        <collectionProp name="Arguments.arguments"/>
      </elementProp>
    </TestPlan>
    <hashTree>
      <ThreadGroup guiclass="ThreadGroupGui" testclass="ThreadGroup" testname="Thread Group">
        <stringProp name="ThreadGroup.on_sample_error">continue</stringProp>
        <intProp name="ThreadGroup.num_threads">1</intProp>
        <intProp name="ThreadGroup.ramp_time">1</intProp>
        <boolProp name="ThreadGroup.same_user_on_next_iteration">true</boolProp>
        <elementProp name="ThreadGroup.main_controller" elementType="LoopController" guiclass="LoopControlPanel" testclass="Loop Controller" testname="Loop Controller">
          <boolProp name="LoopController.continue_forever">false</boolProp>
          <stringProp name="LoopController.loops">100</stringProp>
        </elementProp>
        <boolProp name="ThreadGroup.scheduler">false</boolProp>
        <stringProp name="ThreadGroup.duration"></stringProp>
        <stringProp name="ThreadGroup.delay"></stringProp>
      </ThreadGroup>
      <hashTree>
        <JDBCDataSource guiclass="TestBeanGUI" testclass="JDBCDataSource" testname="JDBC Connection Configuration">
          <stringProp name="dataSource">taos</stringProp>
          <stringProp name="dbUrl">jdbc:TAOS-WS://192.168.1.100:6041,192.168.1.101:6041,192.168.1.102:6041/test?timezone=Asia/Shanghai</stringProp>
          <stringProp name="driver">com.taosdata.jdbc.ws.WebSocketDriver</stringProp>
          <stringProp name="username">root</stringProp>
          <stringProp name="password">taosdata</stringProp>
          <stringProp name="poolMax">10</stringProp>
          <stringProp name="connectionAge">0</stringProp>
          <stringProp name="trimInterval">60000</stringProp>
          <boolProp name="preinit">true</boolProp>
          <intProp name="timeout">10000</intProp>
          <stringProp name="queryTimeout">60</stringProp>
          <boolProp name="keepAlive">true</boolProp>
        </JDBCDataSource>
        <hashTree/>

        <JDBCSampler guiclass="TestBeanGUI" testclass="JDBCSampler" testname="Query Latest Data">
          <stringProp name="dataSource">taos</stringProp>
          <stringProp name="queryType">Select Statement</stringProp>
          <stringProp name="query">SELECT last_row(*) FROM d1001</stringProp>
          <stringProp name="queryTimeout">60</stringProp>
          <stringProp name="resultSetHandler">Count Records</stringProp>
        </JDBCSampler>
        <hashTree/>
      </hashTree>
    </hashTree>
  </hashTree>
</jmeterTestPlan>
Key Parameters
| Param | Description | Recommended Value |
|---|---|---|
| dbUrl | JDBC URL | Update IP/port/DB name |
| driver | JDBC Driver Class | Fixed: com.taosdata.jdbc.ws.WebSocketDriver |
| poolMax | Max connections | < 200 |
| connectionAge | Connection lifetime (ms) | 0 (unlimited) |
| trimInterval | Idle connection cleanup (ms) | 60000 |
| preinit | Pre-init pool | true |
| timeout | Connect timeout (ms) | 10000 |
| keepAlive | Keep connection alive | true |
| queryTimeout | Query timeout (s) | 60 (large queries) |
Run the Test
Standard Mode (full report):
# Set JVM memory
export JVM_ARGS="-Xms4g -Xmx4g -XX:MaxMetaspaceSize=256m -XX:+UseG1GC"

# Run CLI test
jmeter -n -t baseline_test.jmx -l baseline_results.jtl

# Generate HTML report
jmeter -g baseline_results.jtl -o baseline_report/

# Open baseline_report/index.html in browser
High-Concurrency Mode (minimize I/O):
Create perf.properties:
jmeter.save.saveservice.latency=false
jmeter.save.saveservice.connect_time=false
jmeter.save.saveservice.idle_time=false
sampleresult.timestamp.start=false
jmeter.save.saveservice.response_code=false
jmeter.save.saveservice.response_message=false
jmeter.save.saveservice.url=false
jmeter.save.saveservice.label=false
jmeter.save.saveservice.thread_name=false
jmeter.save.saveservice.data_type=false
jmeter.save.saveservice.bytes=false
jmeter.save.saveservice.sent_bytes=false
jmeter.save.saveservice.assertions=false
jmeter.save.saveservice.assertion_results_failure_message=false
jmeter.save.saveservice.subresults=false
jmeter.save.saveservice.thread_counts=false
jmeter.save.saveservice.autoflush=false
Run:
# With reduced logging
jmeter -n -t baseline_test.jmx -l result.jtl -q perf.properties

# No JTL at all (recommended for QPS)
jmeter -n -t baseline_test.jmx
Summary Output Example:
summary +    500 in 00:00:01 =  500.2/s Avg:    2 Min:     1 Max:     5 Err:     0 (0.00%) Active: 4
summary +   1000 in 00:00:02 =  500.0/s Avg:    2 Min:     1 Max:     6 Err:     0 (0.00%) Active: 4
summary =   1500 in 00:00:03 =  500.0/s Avg:    2 Min:     1 Max:     6 Err:     0 (0.00%)
JVM Args:
-Xms4g -Xmx4g: fixed heap to avoid resizing-XX:MaxMetaspaceSize=256m: metadata space-XX:+UseG1GC: low-latency GC
Analyze Results
Open baseline_report/index.html.
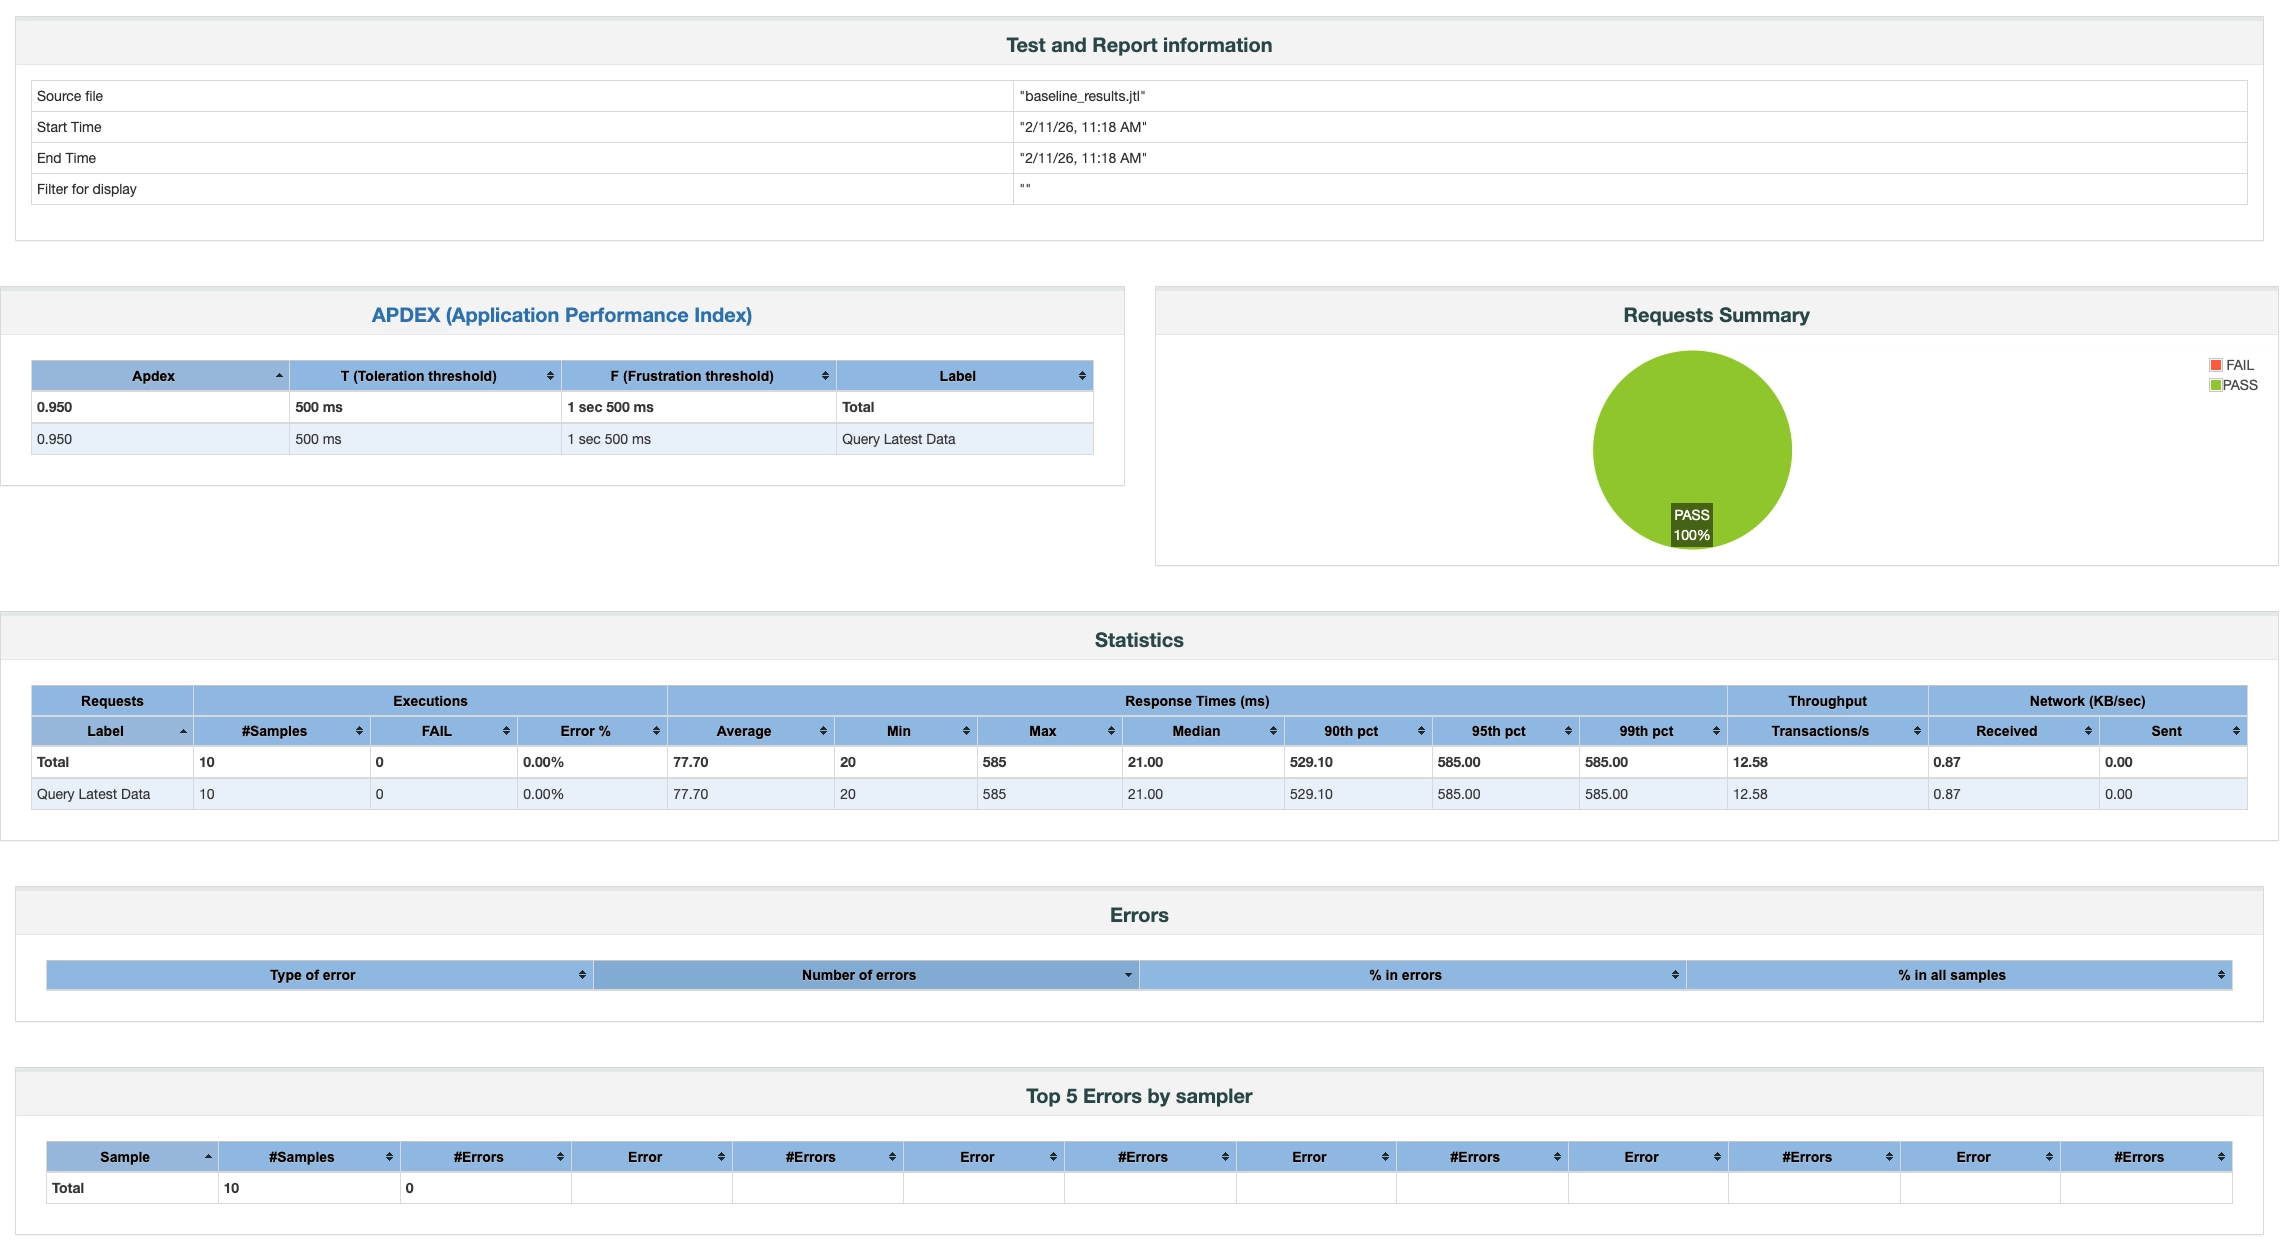
Key Metrics:
| Metric | Meaning | Example |
|---|---|---|
| Throughput | Queries per second (QPS) | 1850.3/sec |
| Average | Avg response time | 15.3ms |
| 90% Line | 90% requests finished | 78ms |
| 95% Line | 95% requests finished | 95ms |
| 99% Line | 99% requests finished | 150ms |
| Error% | Error rate | 0.002% |
Percentile times (90%/95%/99%) better reflect user experience than average.
JDBC Connection Properties
Basic Example (timezone):
<stringProp name="dbUrl">jdbc:TAOS-WS://127.0.0.1:6041/test?timezone=Asia/Shanghai</stringProp>
<stringProp name="driver">com.taosdata.jdbc.ws.WebSocketDriver</stringProp>
Common URLs:
| Scenario | JDBC URL Example |
|---|---|
| Test (single) | jdbc:TAOS-WS://localhost:6041/test?timezone=Asia/Shanghai |
| Production (3 nodes) | jdbc:TAOS-WS://td1:6041,td2:6041,td3:6041/prod_db?timezone=Asia/Shanghai |
See TDengine JDBC Docs for more options.
CSV Parameterized Testing
CSV parameterization simulates real multi-device / multi-scenario queries.
Use Cases
- Query millions of smart meters
- Test different time ranges
- Mix aggregation functions
- Avoid identical requests
Advantages:
- Simple text data
- No JMX changes to update data
- Recycle & share across threads
- Multi-variable support
Create CSV File
# Export child table names (remove quotes)
taos -s "SELECT tags tbname FROM test.meters >> './meters.csv'" && sed -i 's/"//g' meters.csv

# Top 1000 only
taos -s "SELECT tags tbname FROM test.meters limit 1000 >> './meters.csv'" && sed -i 's/"//g' meters.csv

head meters.csv
Sample:
tbname
d37
d47
d87
d130
...
JMX Config
Sample csv_param_test.jmx:
<?xml version="1.0" encoding="UTF-8"?>
<jmeterTestPlan version="1.2" properties="5.0" jmeter="5.6.3">
  <hashTree>
    <TestPlan guiclass="TestPlanGui" testclass="TestPlan" testname="TDengine CSV Param Test" enabled="true">
      <boolProp name="TestPlan.functional_mode">false</boolProp>
      <boolProp name="TestPlan.tearDown_on_shutdown">true</boolProp>
      <boolProp name="TestPlan.serialize_threadgroups">false</boolProp>
    </TestPlan>
    <hashTree>
      <ThreadGroup guiclass="ThreadGroupGui" testclass="ThreadGroup" testname="5min Stress Test" enabled="true">
        <stringProp name="ThreadGroup.on_sample_error">continue</stringProp>
        <elementProp name="ThreadGroup.main_controller" elementType="LoopController">
          <boolProp name="LoopController.continue_forever">true</boolProp>
          <stringProp name="LoopController.loops">-1</stringProp>
        </elementProp>
        <stringProp name="ThreadGroup.num_threads">200</stringProp>
        <stringProp name="ThreadGroup.ramp_time">60</stringProp>
        <boolProp name="ThreadGroup.scheduler">true</boolProp>
        <stringProp name="ThreadGroup.duration">300</stringProp>
        <stringProp name="ThreadGroup.delay">0</stringProp>
      </ThreadGroup>
      <hashTree>
        <JDBCDataSource guiclass="TestBeanGUI" testclass="JDBCDataSource" testname="JDBC Config">
          <stringProp name="dataSource">taos</stringProp>
          <stringProp name="dbUrl">jdbc:TAOS-WS://192.168.1.100:6041,192.168.1.101:6041,192.168.1.102:6041/test?timezone=Asia/Shanghai</stringProp>
          <stringProp name="driver">com.taosdata.jdbc.ws.WebSocketDriver</stringProp>
          <stringProp name="username">root</stringProp>
          <stringProp name="password">taosdata</stringProp>
          <stringProp name="poolMax">200</stringProp>
          <stringProp name="connectionAge">0</stringProp>
          <stringProp name="trimInterval">60000</stringProp>
          <boolProp name="preinit">true</boolProp>
          <intProp name="timeout">10000</intProp>
          <boolProp name="keepAlive">true</boolProp>
        </JDBCDataSource>
        <hashTree/>

        <CSVDataSet guiclass="TestBeanGUI" testclass="CSVDataSet" testname="CSV Data Set">
          <stringProp name="filename">meters.csv</stringProp>
          <stringProp name="variableNames">table_name</stringProp>
          <stringProp name="delimiter">,</stringProp>
          <boolProp name="ignoreFirstLine">true</boolProp>
          <boolProp name="recycle">true</boolProp>
          <stringProp name="shareMode">shareMode.all</stringProp>
        </CSVDataSet>
        <hashTree/>

        <JDBCSampler guiclass="TestBeanGUI" testclass="JDBCSampler" testname="Param Query">
          <stringProp name="dataSource">taos</stringProp>
          <stringProp name="queryType">Select Statement</stringProp>
          <stringProp name="query">SELECT last_row(*) FROM ${table_name}</stringProp>
          <stringProp name="queryTimeout">10</stringProp>
        </JDBCSampler>
        <hashTree/>
      </hashTree>
    </hashTree>
  </hashTree>
</jmeterTestPlan>
CSV Config:
| Param | Description | Recommend |
|---|---|---|
| filename | CSV path | Absolute/relative |
| variableNames | Variable names | Match CSV columns |
| ignoreFirstLine | Skip header | true |
| recycle | Loop data | true |
| shareMode | Thread sharing | shareMode.all |
Parameterization Scenarios
Multi-Device Query
CSV:
table_name
d0
d1
d2
Query:
SELECT last_row(*) FROM ${table_name}
Time-Range Query
CSV:
hours
1h
6h
24h
Query:
SELECT * FROM d1001 WHERE ts > NOW - ${hours}
Aggregation Types
CSV:
agg_type
avg(current)
max(voltage)
min(phase)
Query:
SELECT ${agg_type} FROM d1001 WHERE ts > NOW - 1h
Run Test
export JVM_ARGS="-Xms4g -Xmx4g -XX:+UseG1GC"
jmeter -n -t csv_param_test.jmx
Multi-Variable Parameterization
CSV:
table_name,group_id
d0,1
d1,1
d2,2
JMX:
<CSVDataSet>
  <stringProp name="variableNames">table_name,group_id</stringProp>
</CSVDataSet>

<JDBCSampler>
  <stringProp name="query">SELECT * FROM ${table_name} WHERE group_id = ${group_id}</stringProp>
</JDBCSampler>
Random Parameter Testing
Random parameters simulate unpredictable real-world query patterns.
Use Cases
- Random meter queries
- Random time ranges
- Avoid hot-spot queries
JMX Config
Sample random_param_test.jmx:
<?xml version="1.0" encoding="UTF-8"?>
<jmeterTestPlan version="1.2" properties="5.0" jmeter="5.6.3">
  <hashTree>
    <TestPlan guiclass="TestPlanGui" testclass="TestPlan" testname="TDengine Random Param Test">
    </TestPlan>
    <hashTree>
      <ThreadGroup guiclass="ThreadGroupGui" testclass="ThreadGroup" testname="Thread Group">
        <intProp name="ThreadGroup.num_threads">200</intProp>
        <intProp name="ThreadGroup.ramp_time">5</intProp>
        <elementProp name="ThreadGroup.main_controller" elementType="LoopController">
          <boolProp name="LoopController.continue_forever">false</boolProp>
          <stringProp name="LoopController.loops">10000</stringProp>
        </elementProp>
      </ThreadGroup>
      <hashTree>
        <JDBCDataSource guiclass="TestBeanGUI" testclass="JDBCDataSource" testname="JDBC Config">
          <stringProp name="dataSource">taos</stringProp>
          <stringProp name="dbUrl">jdbc:TAOS-WS://192.168.1.100:6041,192.168.1.101:6041,192.168.1.102:6041/test?timezone=Asia/Shanghai</stringProp>
          <stringProp name="driver">com.taosdata.jdbc.ws.WebSocketDriver</stringProp>
          <stringProp name="username">root</stringProp>
          <stringProp name="password">taosdata</stringProp>
          <stringProp name="poolMax">200</stringProp>
        </JDBCDataSource>
        <hashTree/>

        <JDBCSampler guiclass="TestBeanGUI" testclass="JDBCSampler" testname="Random Query">
          <stringProp name="dataSource">taos</stringProp>
          <stringProp name="query">SELECT * FROM d${__Random(1001,2000)} WHERE ts > NOW - ${__Random(1,24)}h LIMIT 100</stringProp>
        </JDBCSampler>
        <hashTree/>
      </hashTree>
    </hashTree>
  </hashTree>
</jmeterTestPlan>
Adjust Parameters
| Goal | Change |
|---|---|
| Random table range | __Random(1001,2000) |
| Random time range | __Random(1,24) |
| Result rows | LIMIT 100 |
Run Test
export JVM_ARGS="-Xms4g -Xmx4g -XX:+UseG1GC"
jmeter -n -t random_param_test.jmx
Command-Line Property Parameterization
Parameterize via CLI without editing JMX.
Use Cases
- Quick config switching
- CI/CD automation
- Batch testing
Basic Usage
Use ${__P(prop, default)} in JMX.
Sample param_test.jmx:
<?xml version="1.0" encoding="UTF-8"?>
<jmeterTestPlan version="1.2" properties="5.0" jmeter="5.6.3">
  <hashTree>
    <TestPlan guiclass="TestPlanGui" testclass="TestPlan" testname="TDengine CLI Param Test">
      <elementProp name="TestPlan.user_defined_variables" elementType="Arguments">
        <collectionProp name="Arguments.arguments">
          <elementProp name="THREADS" elementType="Argument">
            <stringProp name="Argument.name">THREADS</stringProp>
            <stringProp name="Argument.value">${__P(threads,10)}</stringProp>
          </elementProp>
          <elementProp name="LOOPS" elementType="Argument">
            <stringProp name="Argument.name">LOOPS</stringProp>
            <stringProp name="Argument.value">${__P(loops,100)}</stringProp>
          </elementProp>
        </collectionProp>
      </elementProp>
    </TestPlan>
    <hashTree>
      <JDBCDataSource guiclass="TestBeanGUI" testclass="JDBCDataSource">
        <stringProp name="dataSource">taos</stringProp>
        <stringProp name="dbUrl">jdbc:TAOS-WS://192.168.1.100:6041,192.168.1.101:6041,192.168.1.102:6041/test?timezone=Asia/Shanghai</stringProp>
        <stringProp name="driver">com.taosdata.jdbc.ws.WebSocketDriver</stringProp>
        <stringProp name="poolMax">200</stringProp>
      </JDBCDataSource>
      <hashTree/>

      <ThreadGroup guiclass="ThreadGroupGui" testclass="ThreadGroup">
        <stringProp name="ThreadGroup.num_threads">${__P(threads,10)}</stringProp>
        <elementProp name="ThreadGroup.main_controller" elementType="LoopController">
          <stringProp name="LoopController.loops">${__P(loops,100)}</stringProp>
        </elementProp>
      </ThreadGroup>
      <hashTree>
        <JDBCSampler guiclass="TestBeanGUI" testclass="JDBCSampler">
          <stringProp name="query">SELECT last_row(*) FROM d${__Random(1,200000)}</stringProp>
        </JDBCSampler>
        <hashTree/>
      </hashTree>
    </hashTree>
  </hashTree>
</jmeterTestPlan>
Run Different Tests
# Default: 10 threads × 100 loops
jmeter -n -t param_test.jmx

# 100 threads × 20000 loops
jmeter -n -t param_test.jmx -Jthreads=100 -Jloops=20000
JMeter Functions
| Function | Meaning |
|---|---|
${__P(name, default)} | Read JMeter property |
${__threadNum} | Current thread number |
${__machineName} | Hostname |
Batch Test Script
Sample batch_test.sh:
#!/bin/bash
echo "=== Batch Concurrency Test ==="

CONFIGS=(
  "10:100:Light"
  "50:100:Medium"
  "100:100:Heavy"
  "200:50:Stress"
)

for cfg in "${CONFIGS[@]}"; do
  IFS=':' read -r threads loops desc <<< "$cfg"
  echo "Running: $desc ($threads threads × $loops loops)"
  export JVM_ARGS="-Xms8g -Xmx8g -XX:+UseG1GC"
  jmeter -n -t param_test.jmx -Jthreads=$threads -Jloops=$loops
done
chmod +x batch_test.sh
./batch_test.sh
Concurrency Configuration Test
Test system behavior under different loads.
Use Cases
- 10 / 50 / 100 / 200 threads
- Find bottlenecks
- Determine max safe concurrency
Run Concurrency Tests
export JVM_ARGS="-Xms8g -Xmx8g -XX:MaxMetaspaceSize=512m -XX:+UseG1GC"

jmeter -n -t param_test.jmx
jmeter -n -t param_test.jmx -Jthreads=50
jmeter -n -t param_test.jmx -Jthreads=100
jmeter -n -t param_test.jmx -Jthreads=200
Step Stress Test
for threads in 10 50 100 200; do
  echo "Testing $threads threads..."
  jmeter -n -t param_test.jmx -Jthreads=$threads
done
Result Analysis Example
Threads | Avg RT | 90% RT | QPS  | Error%
--------|--------|--------|------|-------
10      | 15ms   | 20ms   | 650  | 0%
50      | 45ms   | 78ms   | 1100 | 0%
100     | 120ms  | 250ms  | 830  | 0.01%
200     | 450ms  | 800ms  | 440  | 5%
- 10–50 threads: linear scaling
- 100 threads: RT rises but errors low
- 200 threads: bottleneck reached
Recommendation: 50–100 threads for production.
Mixed Scenario Test
Simulate real mixed query traffic.
Scenario Ratio
- 70% real-time (
last_row) - 25% historical (time range)
- 5% aggregation (group by)
JMX Config
Sample mixed_scenario_test.jmx:
<jmeterTestPlan version="1.2" properties="5.0" jmeter="5.6.3">
  <hashTree>
    <TestPlan name="Mixed Query 5min Test"></TestPlan>
    <hashTree>
      <JDBCDataSource name="JDBC Config">
        <stringProp name="dataSource">taos</stringProp>
        <stringProp name="dbUrl">jdbc:TAOS-WS://192.168.1.100:6041,192.168.1.101:6041,192.168.1.102:6041/test?timezone=Asia/Shanghai</stringProp>
        <stringProp name="driver">com.taosdata.jdbc.ws.WebSocketDriver</stringProp>
        <stringProp name="poolMax">100</stringProp>
      </JDBCDataSource>
      <hashTree/>

      <CSVDataSet name="CSV Data">
        <stringProp name="filename">meters.csv</stringProp>
        <stringProp name="variableNames">table_name</stringProp>
        <boolProp name="ignoreFirstLine">true</boolProp>
        <boolProp name="recycle">true</boolProp>
      </CSVDataSet>
      <hashTree/>

      <ThreadGroup name="Mixed Load">
        <intProp name="ThreadGroup.num_threads">100</intProp>
        <intProp name="ThreadGroup.ramp_time">15</intProp>
        <boolProp name="ThreadGroup.scheduler">true</boolProp>
        <stringProp name="ThreadGroup.duration">300</stringProp>
      </ThreadGroup>
      <hashTree>
        <!-- 70% realtime -->
        <ThroughputController name="70% Realtime">
          <intProp name="ThroughputController.style">1</intProp>
          <stringProp name="ThroughputController.percentThroughput">70.0</stringProp>
        </ThroughputController>
        <hashTree>
          <JDBCSampler name="Last Row Query">
            <stringProp name="query">SELECT last_row(*) FROM ${table_name}</stringProp>
          </JDBCSampler>
        </hashTree>

        <!-- 25% history -->
        <ThroughputController name="25% History">
          <stringProp name="ThroughputController.percentThroughput">25.0</stringProp>
        </ThroughputController>
        <hashTree>
          <JDBCSampler name="History Query">
            <stringProp name="query">SELECT * FROM ${table_name} WHERE ts > NOW - 24h LIMIT 1000</stringProp>
          </JDBCSampler>
        </hashTree>

        <!-- 5% aggregation -->
        <ThroughputController name="5% Aggregation">
          <stringProp name="ThroughputController.percentThroughput">5.0</stringProp>
        </ThroughputController>
        <hashTree>
          <JDBCSampler name="Agg Query">
            <stringProp name="query">SELECT location, avg(current), max(voltage)
                                    FROM meters
                                    WHERE ts > NOW - 24h and group_id = ${__Random(1,200)}
                                    PARTITION BY location</stringProp>
          </JDBCSampler>
        </hashTree>
      </hashTree>
    </hashTree>
  </hashTree>
</jmeterTestPlan>
Run & Analyze
export JVM_ARGS="-Xms8g -Xmx8g -XX:MaxMetaspaceSize=512m -XX:+UseG1GC"
jmeter -n -t mixed_scenario_test.jmx
Sample result:
Scene        | Avg RT | QPS   | %
-------------|--------|-------|-----
Realtime     | 25ms   | 2400  | 70%
History      | 180ms  | 165   | 25%
Aggregation  | 450ms  | 22    | 5%
How to Identify TDengine Bottlenecks
Judge bottlenecks from JMeter metrics and server stats.
From JMeter Results
1. QPS Stagnates / Drops:
- Threads ↑ but QPS flat or down → bottleneck
2. Response Time Surges:
- 99% line jumps > 500ms → saturation
3. Error Rate Rises:
-
0.1% and rising → overloaded
From TDengine Server Metrics
Recommended tools:
- taosKeeper (built-in metrics exporter)
- TDinsight (Grafana dashboard)
Key Server Metrics:
- CPU: taosd + taosAdapter > 80% → CPU bound
- Memory: high RSS / OOM → memory pressure
- Disk I/O: util > 80% → storage bottleneck
- Network: near bandwidth limit → network bound
Bottleneck Decision Flow
- JMeter: QPS flat, RT up, errors up
- Check server: CPU / memory / disk / net
- Classify bottleneck
- Tune accordingly
Practical Tips
- Step pressure: 10 → 50 → 100 → 200 threads
- Fixed-duration tests (5+ min)
- Watch for stable QPS
Common Mistakes
- Only look at average RT (use percentiles)
- Chase 0% errors (small errors acceptable at very high concurrency)
- Draw conclusions from one run (repeat tests)
FAQ & Troubleshooting
Connection Issues
1. JDBC Driver Not Found:
Cannot load JDBC driver class 'com.taosdata.jdbc.ws.WebSocketDriver'
Fix:
cp taos-jdbcdriver-*.jar $JMETER_HOME/lib/ext/
2. Connection Timeout:
java.sql.SQLException: TDengine Error: connection timeout
Fix:
- Check TDengine/taosAdapter status
- Increase timeout in JMX:
<intProp name="timeout">30000</intProp> - Use port 6041 (WebSocket), not 6030
3. Too Many Open Files:
java.io.IOException: Too many open files
Fix:
ulimit -n 65535
Performance Issues
1. OutOfMemoryError:
java.lang.OutOfMemoryError: Java heap space
Fix:
export JVM_ARGS="-Xms8g -Xmx8g -XX:MaxMetaspaceSize=512m -XX:+UseG1GC"
2. Connection Pool Exhausted:
java.sql.SQLException: Timeout waiting for idle connection
Fix:
- Increase
poolMaxin JDBC config - Tune taosAdapter concurrent limits
3. Query Timeout:
java.sql.SQLException: TDengine Error: query timeout
Fix:
- Raise
queryTimeout - Add
LIMIT/ time-range filters - Optimize SQL