Grafana
TDengine can be quickly integrated with the open-source data visualization system Grafana to build a data monitoring and alerting system. The whole process does not require any code development. And you can visualize the contents of the data tables in TDengine on a dashboard. You can learn more about using the TDengine plugin on GitHub.
Prerequisites
In order for Grafana to add the TDengine data source successfully, the following preparations are required:
- The TDengine cluster is deployed and functioning properly
- taosAdapter is installed and running properly. Please refer to the taosAdapter manual for details.
Record these values:
- TDengine REST API url:
http://tdengine.local:6041. - TDengine cluster authorization, with user + password.
Installing Grafana
TDengine currently supports Grafana versions 7.5 and above. Users can go to the Grafana official website to download the installation package and execute the installation according to the current operating system. The download address is as follows: https://grafana.com/grafana/download.
Configuring Grafana
Install Grafana Plugin and Configure Data Source
- With GUI
- With Script
- Install & Configure Manually
- Container
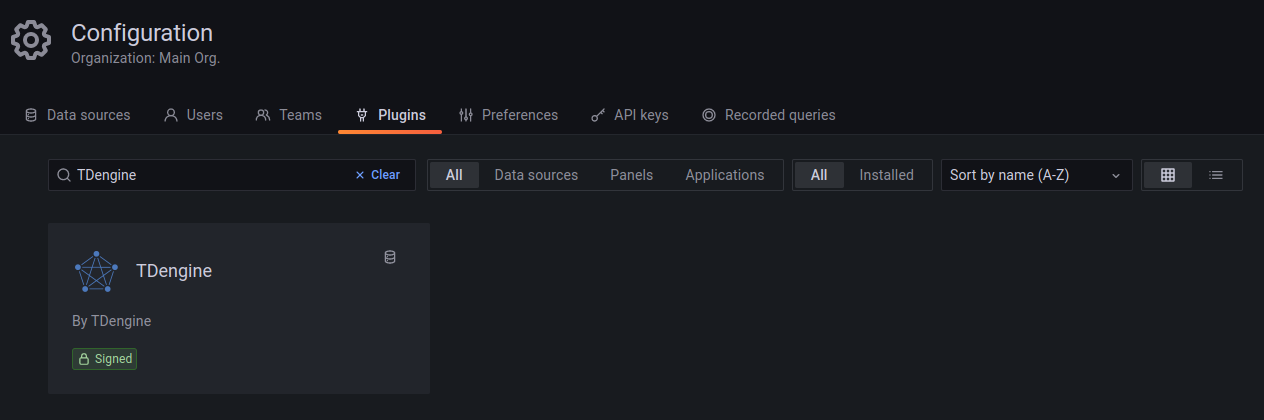
Under Grafana 8, plugin catalog allows you to browse and manage plugins within Grafana (but for Grafana 7.x, use With Script or Install & Configure Manually). Find the page at Configurations > Plugins, search TDengine and click it to install.
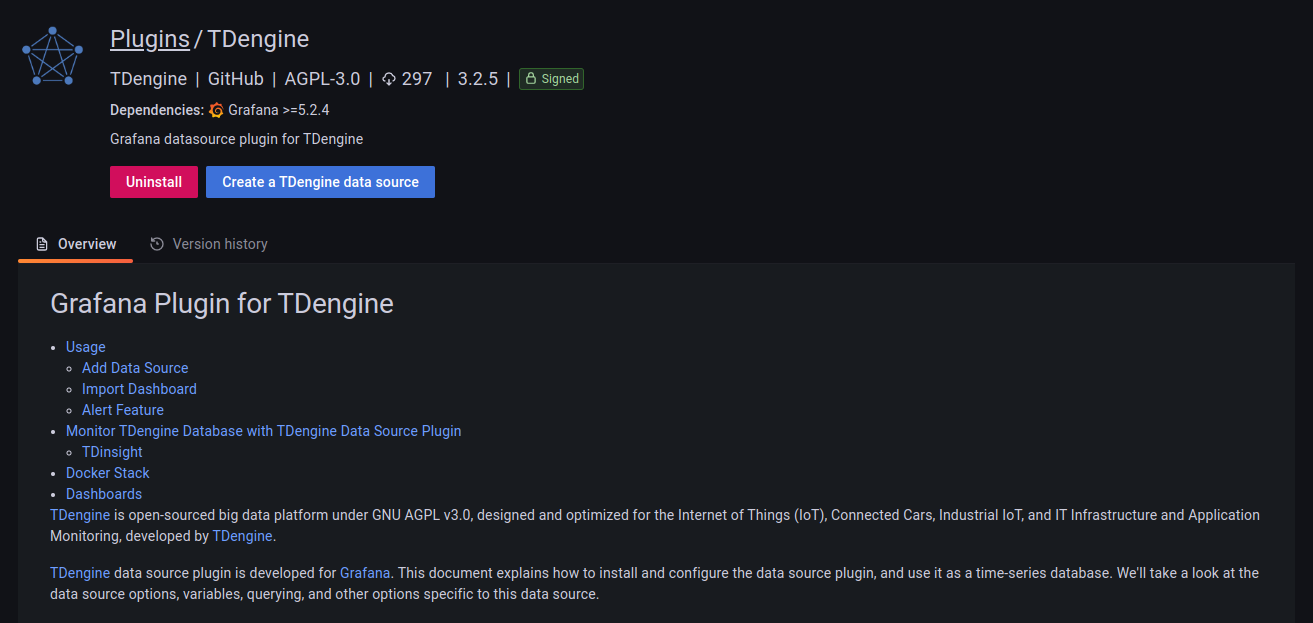
Installation may cost some minutes, then you can Create a TDengine data source:
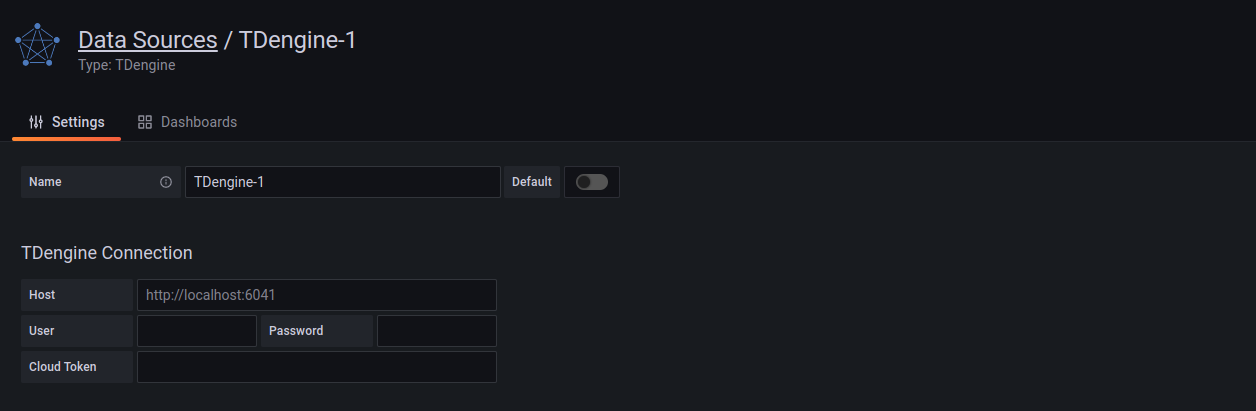
Then you can add a TDengine data source by filling up the configuration options.
You can create dashboards with TDengine now.
On a server with Grafana installed, run install.sh with TDengine url and username/passwords will install TDengine data source plugin and add a data source named TDengine. This is the recommended way for Grafana 7.x or Grafana provisioning users.
bash -c "$(curl -fsSL \
  https://raw.githubusercontent.com/taosdata/grafanaplugin/master/install.sh)" -- \
  -a http://localhost:6041 \
  -u root \
  -p taosdata
Restart Grafana service and open Grafana in web-browser, usually http://localhost:3000.
Save the script and type ./install.sh --help for the full usage of the script.
Follow the installation steps in Grafana with the grafana-cli command-line tool for plugin installation.
grafana-cli plugins install tdengine-datasource
# with sudo
sudo -u grafana grafana-cli plugins install tdengine-datasource
You can also download zip files from GitHub or Grafana and install manually. The commands are as follows:
GF_VERSION=3.3.1
# from GitHub
wget https://github.com/taosdata/grafanaplugin/releases/download/v$GF_VERSION/tdengine-datasource-$GF_VERSION.zip
# from Grafana
wget -O tdengine-datasource-$GF_VERSION.zip https://grafana.com/api/plugins/tdengine-datasource/versions/$GF_VERSION/download
Take CentOS 7.2 for example, extract the plugin package to /var/lib/grafana/plugins directory, and restart grafana.
sudo unzip tdengine-datasource-$GF_VERSION.zip -d /var/lib/grafana/plugins/
If Grafana is running in a Docker environment, the TDengine plugin can be automatically installed and set up using the following environment variable settings:
GF_INSTALL_PLUGINS=tdengine-datasource
Now users can log in to the Grafana server (username/password: admin/admin) directly through the URL http://localhost:3000 and add a datasource through Configuration -> Data Sources on the left side, as shown in the following figure.
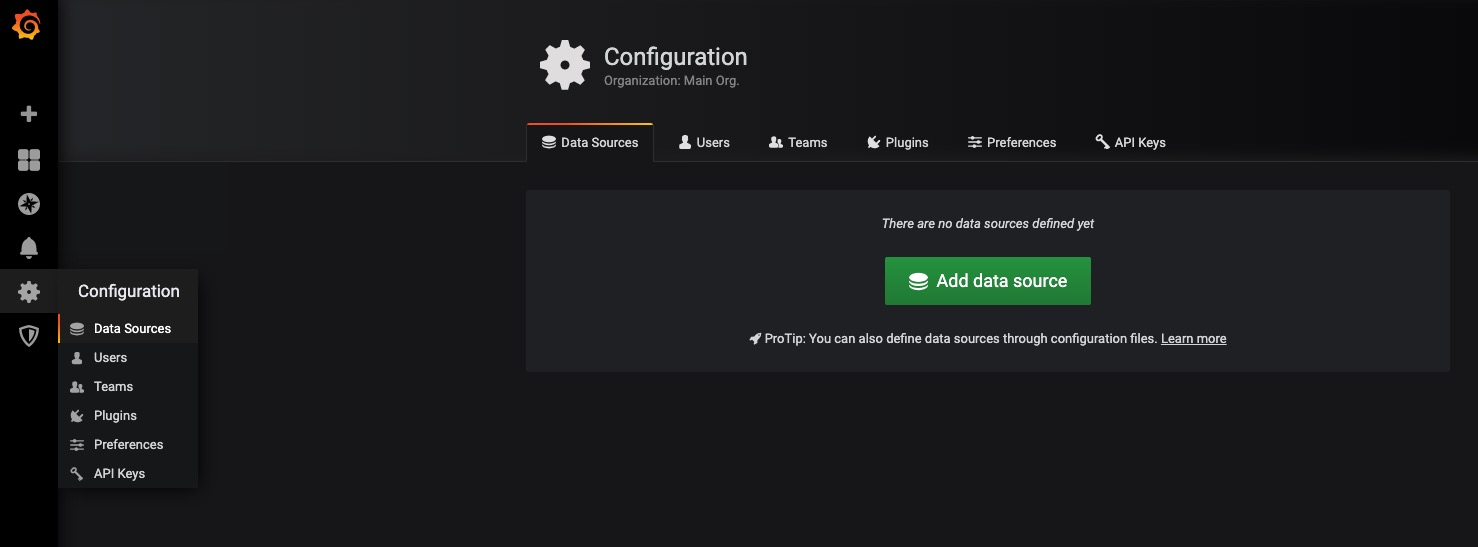
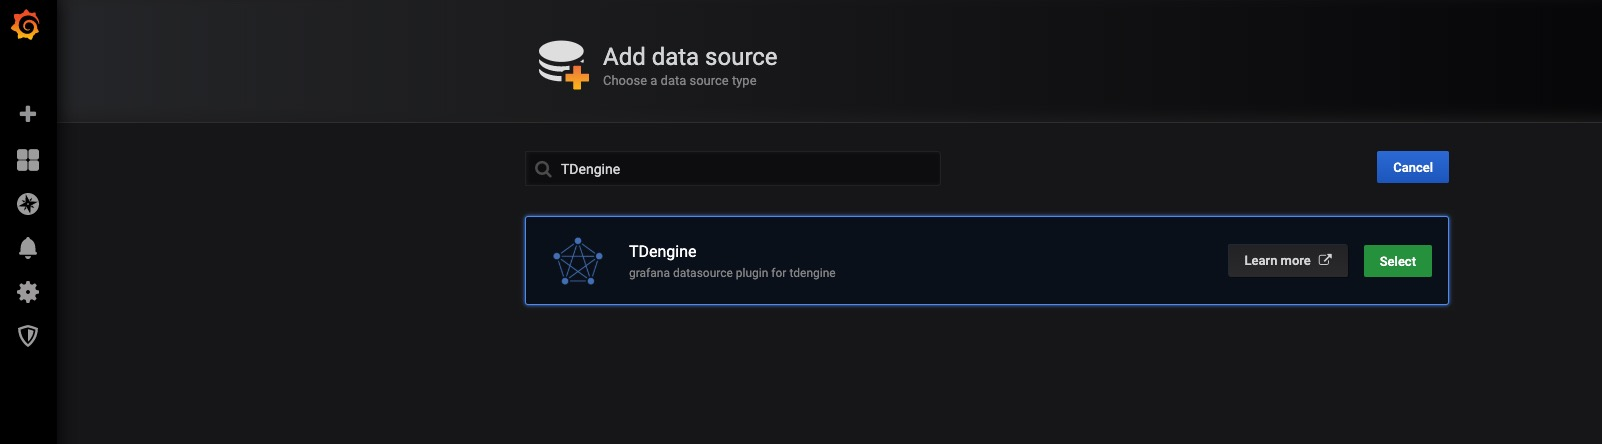
Click Add data source to enter the Add data source page, and enter TDengine in the query box to add it, as shown in the following figure.
Enter the datasource configuration page, and follow the default prompts to modify the corresponding configuration.
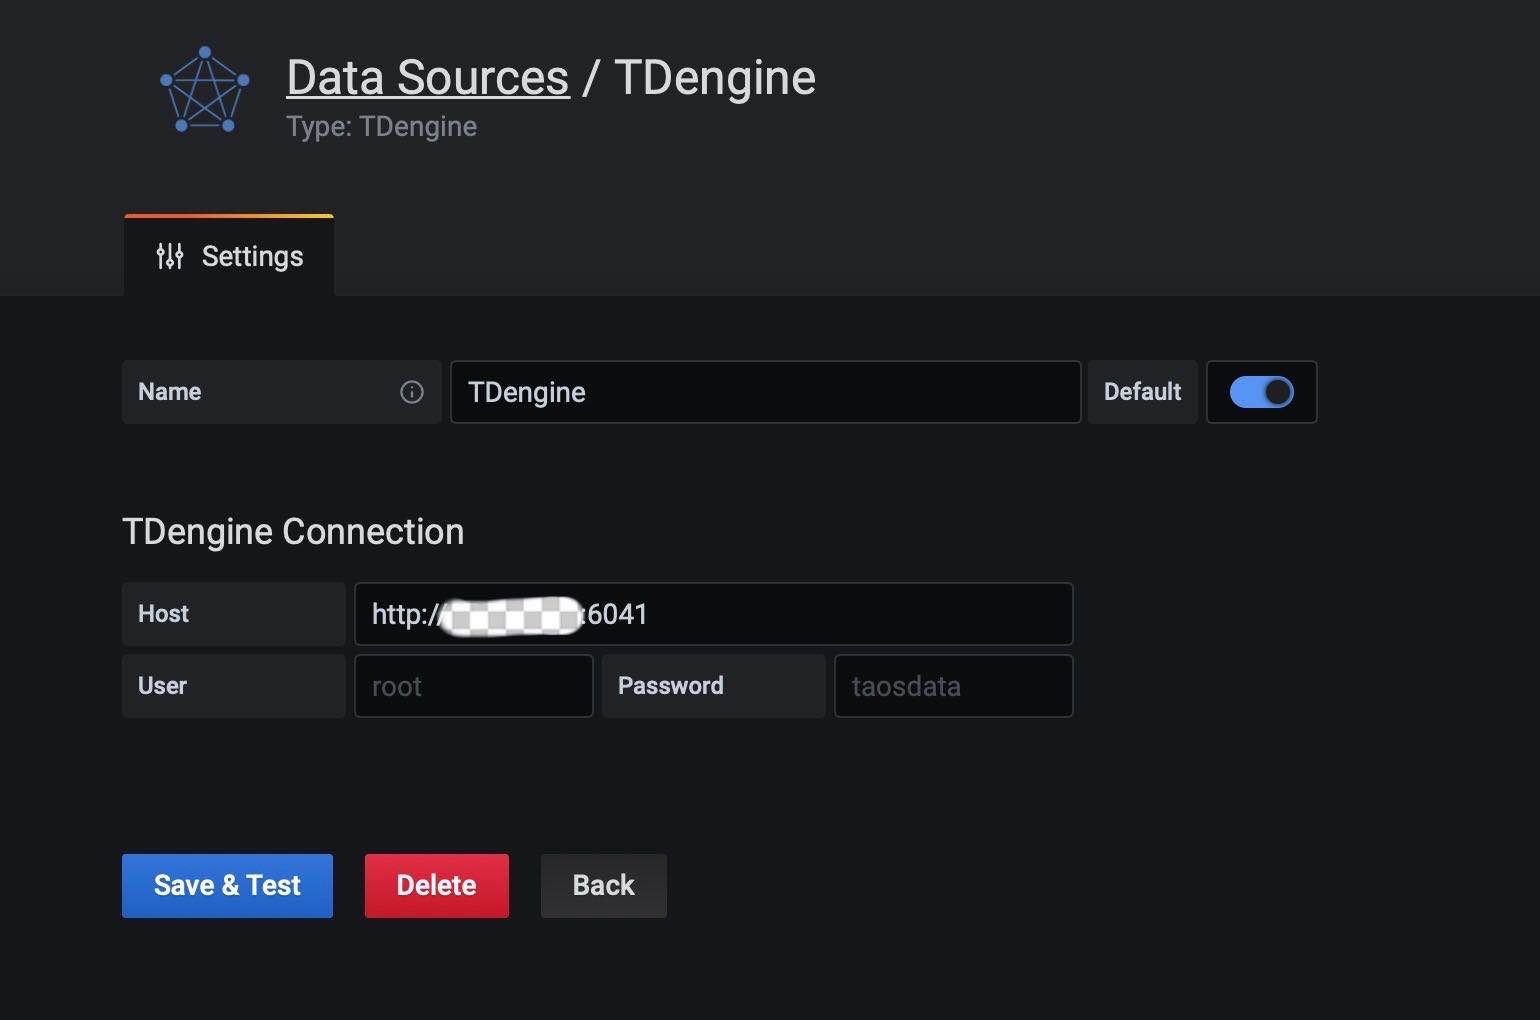
- Host: IP address of the server where the components of the TDengine cluster provide REST service (offered by taosd before 2.4 and by taosAdapter since 2.4) and the port number of the TDengine REST service (6041), by default use
http://localhost:6041. - User: TDengine user name.
- Password: TDengine user password.
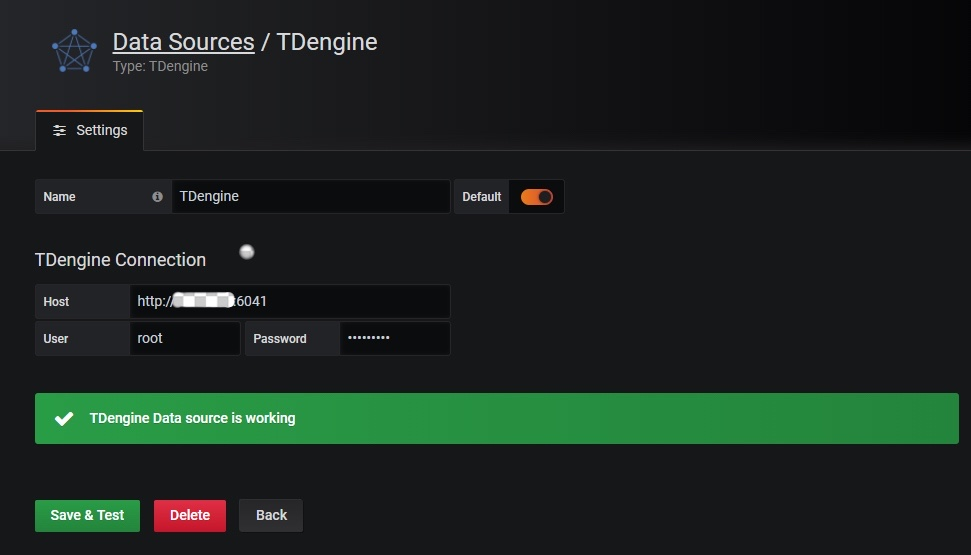
Click Save & Test to test. You should see a success message if the test worked.
Please refer to Install plugins in the Docker container. This will install tdengine-datasource plugin when Grafana container starts:
docker run -d \
  -p 3000:3000 \
  --name=grafana \
  -e "GF_INSTALL_PLUGINS=tdengine-datasource" \
  grafana/grafana
You can setup a zero-configuration stack for TDengine + Grafana by docker-compose and Grafana provisioning file:
-
Save the provisioning configuration file to
tdengine.yml.apiVersion: 1
datasources:
- name: TDengine
type: tdengine-datasource
orgId: 1
url: "$TDENGINE_API"
isDefault: true
secureJsonData:
url: "$TDENGINE_URL"
basicAuth: "$TDENGINE_BASIC_AUTH"
token: "$TDENGINE_CLOUD_TOKEN"
version: 1
editable: true -
Write
docker-compose.ymlwith TDengine and Grafana image.version: "3.7"
services:
tdengine:
image: tdengine/tdengine:3.0.2.4
environment:
TAOS_FQDN: tdengine
volumes:
- tdengine-data:/var/lib/taos/
grafana:
image: grafana/grafana:9.3.6
volumes:
- ./tdengine.yml/:/etc/grafana/provisioning/tdengine.yml
- grafana-data:/var/lib/grafana
environment:
# install tdengine plugin at start
GF_INSTALL_PLUGINS: "tdengine-datasource"
TDENGINE_URL: "http://tdengine:6041"
#printf "$TDENGINE_USER:$TDENGINE_PASSWORD" | base64
TDENGINE_BASIC_AUTH: "cm9vdDp0YmFzZTEyNQ=="
ports:
- 3000:3000
volumes:
grafana-data:
tdengine-data: -
Start TDengine and Grafana services:
docker-compose up -d.
Open Grafana (http://localhost:3000), and you can add dashboard with TDengine now.
Create Dashboard
Go back to the main interface to create a dashboard and click Add Query to enter the panel query page:
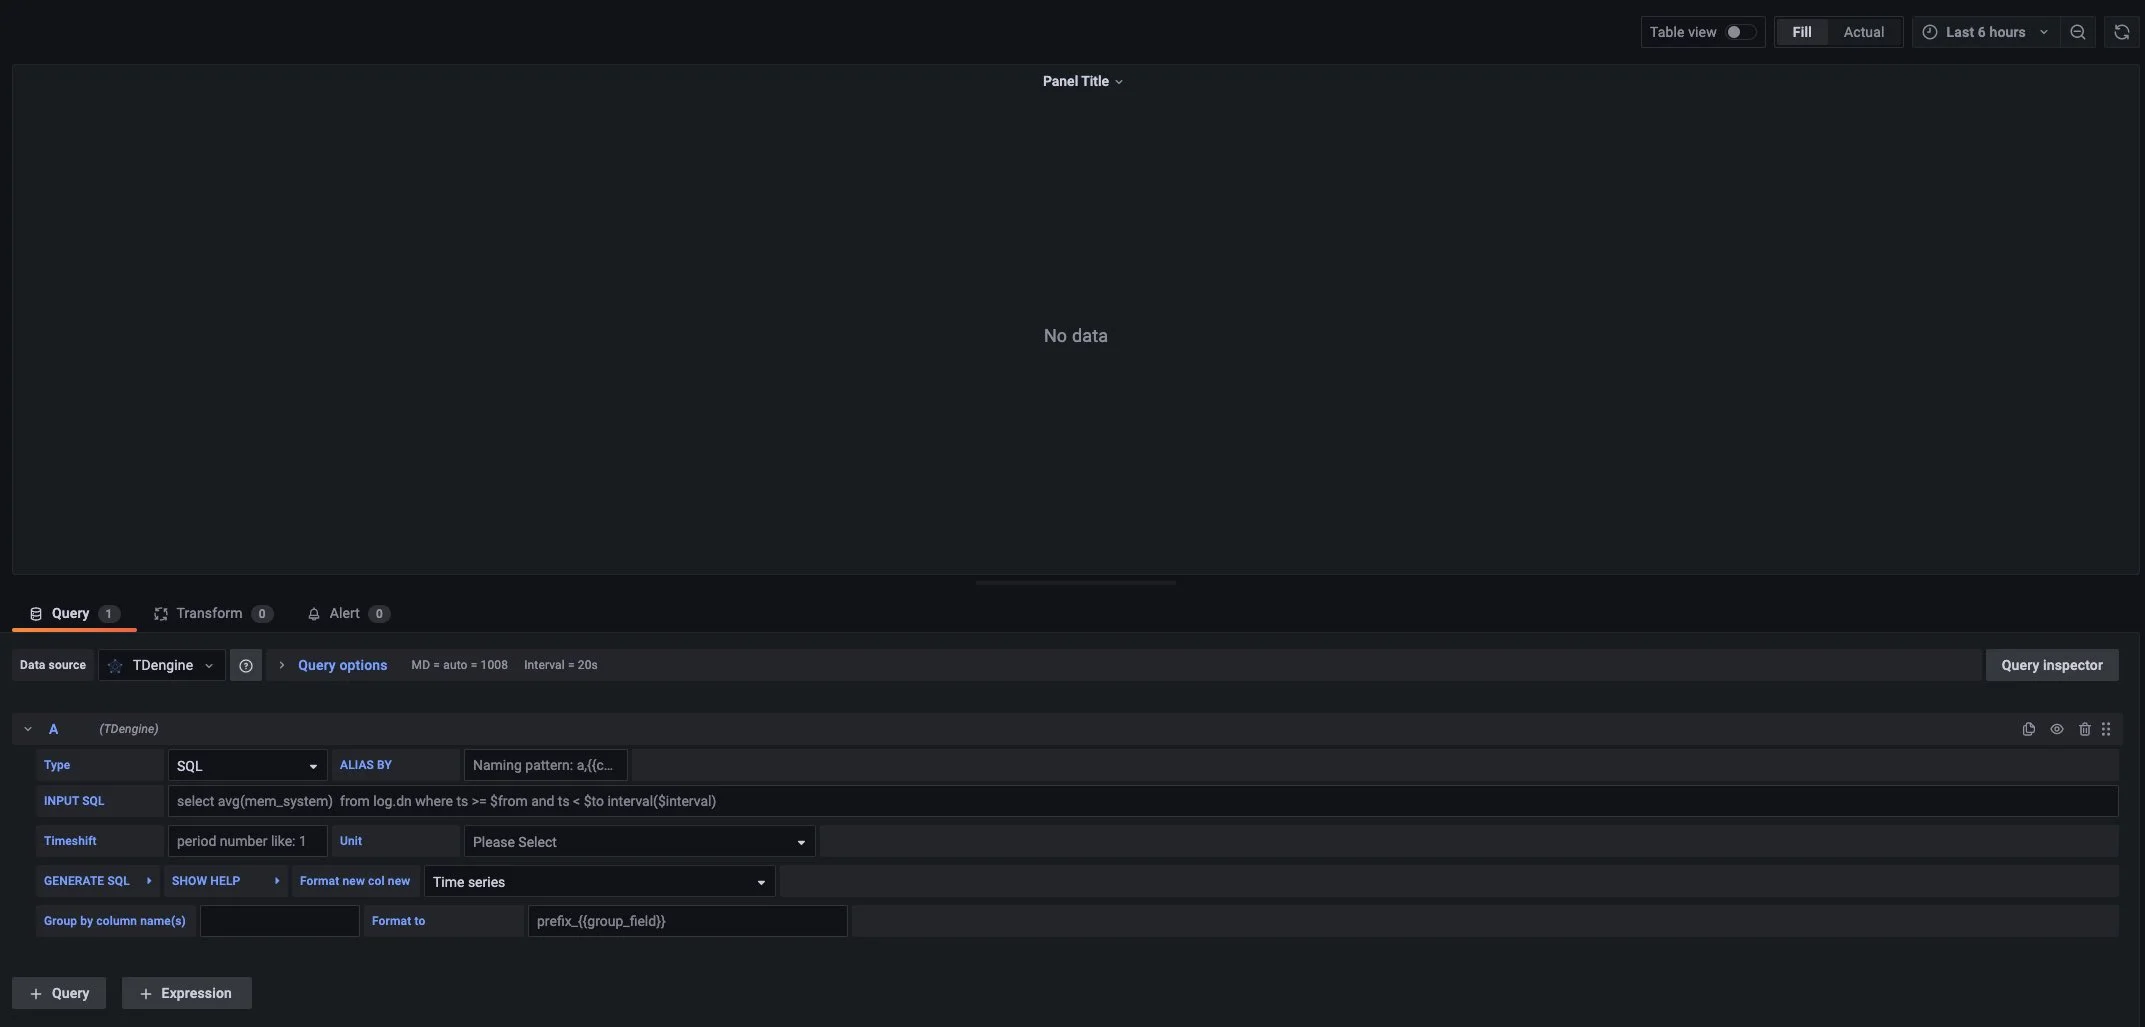
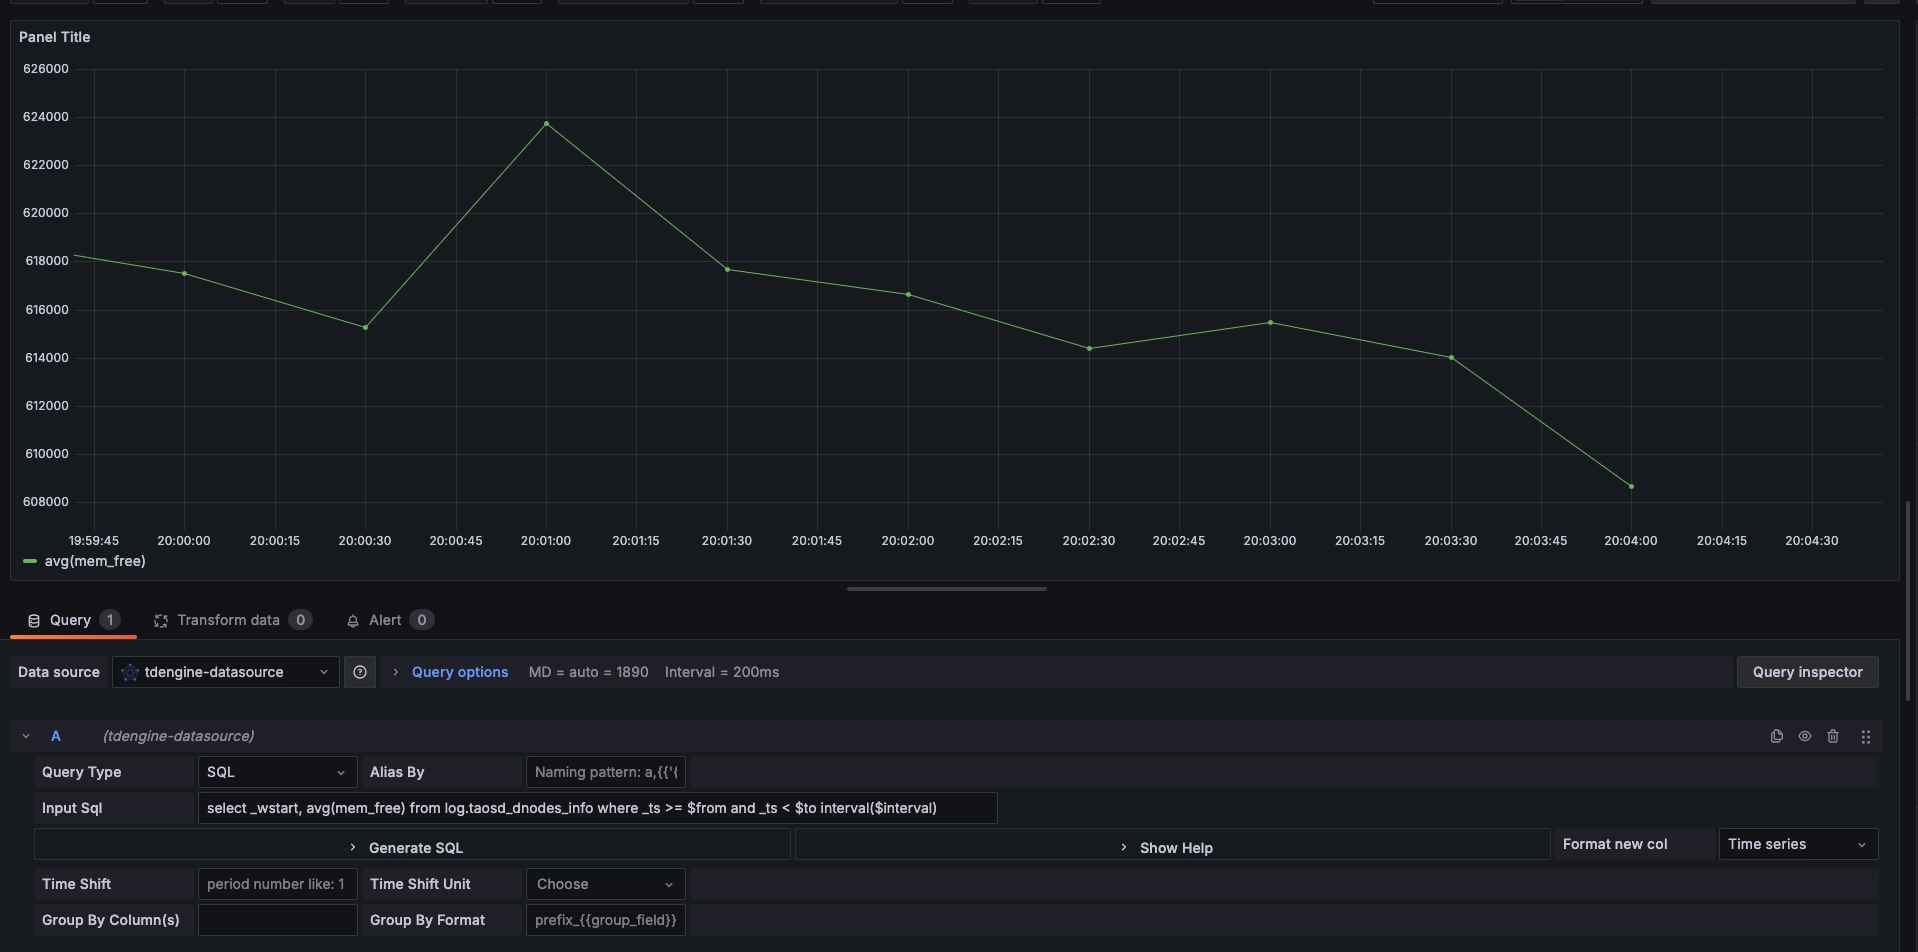
As shown above, select the TDengine data source in the Query and enter the corresponding SQL in the query box below for query.
- INPUT SQL: Enter the desired query (the results being two columns and multiple rows), such as
select _wstart, avg(mem_free) from log.taosd_dnodes_info where _ts >= $from and _ts < $to interval($interval). In this statement, $from, $to, and $interval are variables that Grafana replaces with the query time range and interval. In addition to the built-in variables, custom template variables are also supported. - ALIAS BY: This allows you to set the current query alias.
- GENERATE SQL: Clicking this button will automatically replace the corresponding variables and generate the final executed statement.
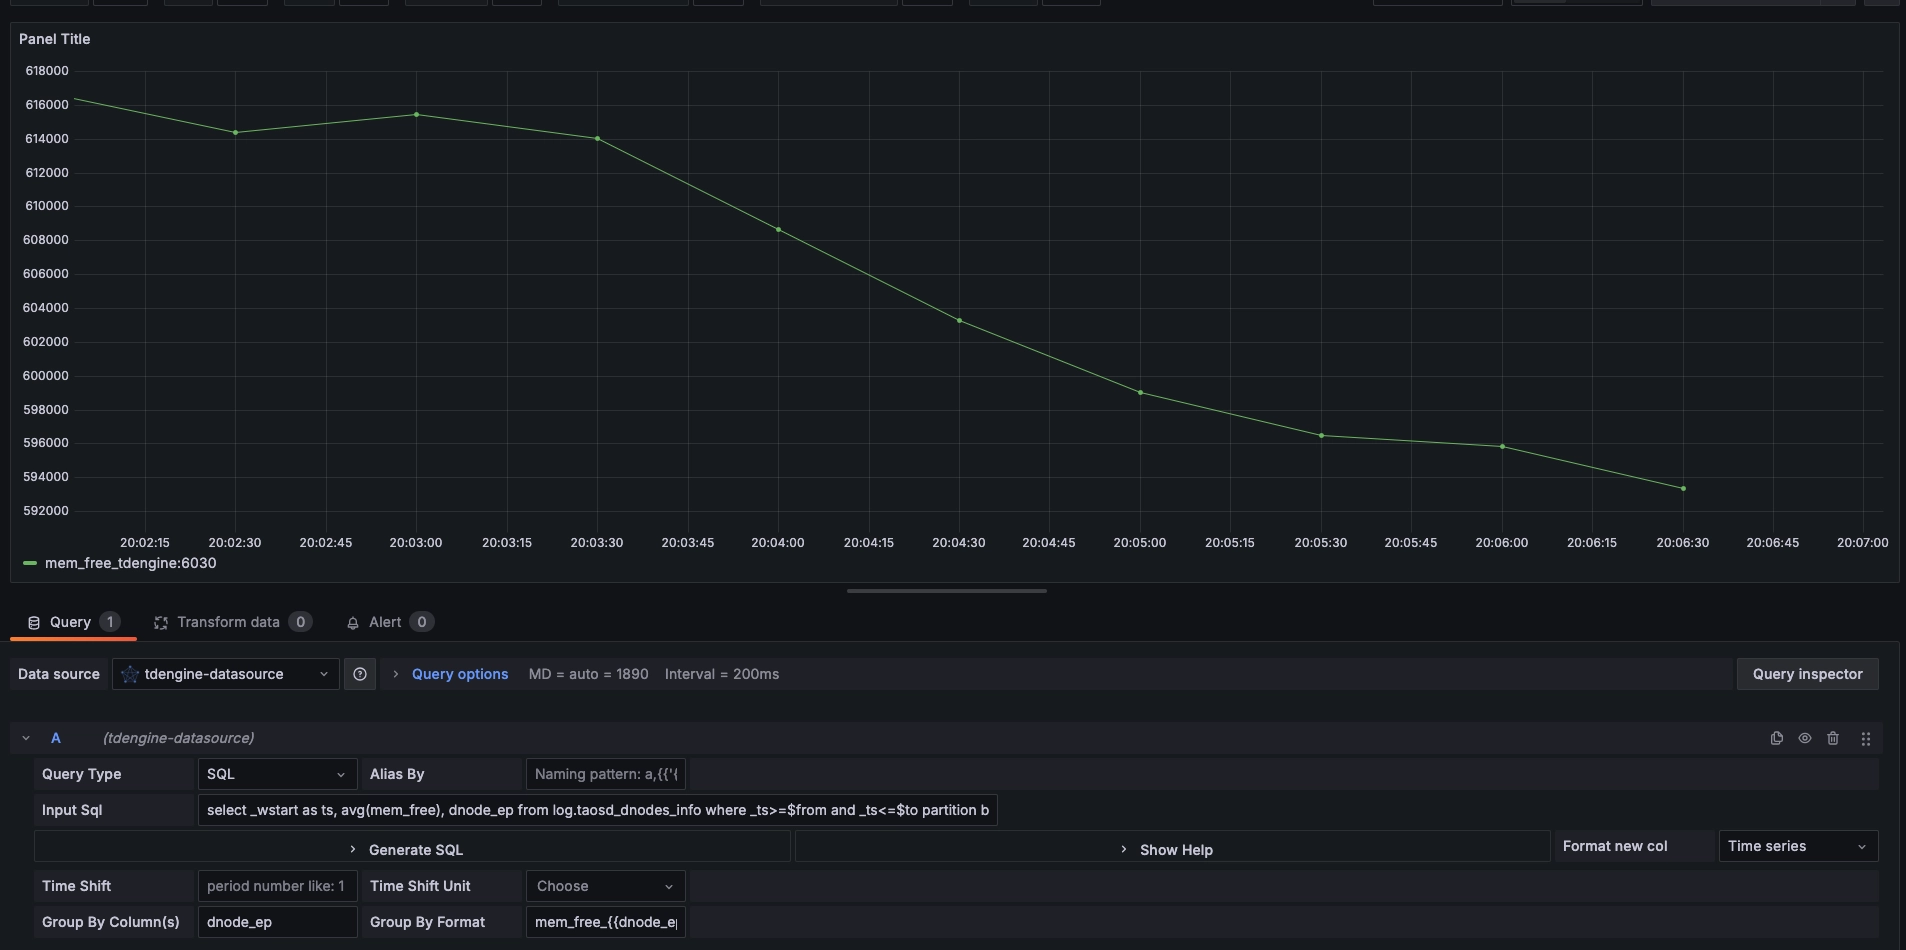
- Group by column name(s):
group byorpartition bycolumns name split by comma. By settingGroup by column name(s), it can show multi-dimension data if Sql isgroup byorpartition by. Such as, it can show data bydnode_epif sql isselect _wstart as ts, avg(mem_free), dnode_ep from log.taosd_dnodes_info where _ts>=$from and _ts<=$to partition by dnode_ep interval($interval)andGroup by column name(s)isdnode_ep. - Format to: format legend for
group byorpartition by. Such as it can display series data bydnode_epif sql isselect _wstart as ts, avg(mem_free), dnode_ep from log.taosd_dnodes_info where _ts>=$from and _ts<=$to partition by dnode_ep interval($interval)andGroup by column name(s)isdnode_epandFormat toismem_free_{{dnode_ep}}.
Since the REST connection because is stateless. Grafana plugin can use <db_name>.<table_name> in the SQL command to specify the database name.
Follow the default prompt to query the average system free memory for the specified interval on the server where the current TDengine deployment is located as follows.
The example to query the average system free memory for the specified interval on each server as follows.
For more information on how to use Grafana to create the appropriate monitoring interface and for more details on using Grafana, refer to the official Grafana documentation.
Importing the Dashboard
You can install TDinsight dashboard in data source configuration page (like http://localhost:3000/datasources/edit/1/dashboards) as a monitoring visualization tool for TDengine cluster. Ensure that you use TDinsight for 3.x. Please note TDinsight for 3.x needs to configure and run taoskeeper correctly.

A dashboard for TDengine 2.x has been published on Grafana: Dashboard 15167 - TDinsight).
For more dashboards using TDengine data source, search here in Grafana. Here is a sub list:
